One platform, one login and one Admin for six business simulations, on a design system of its own.

Deployed and live in production.
Favorite

Project facts

Role
Product design and direction. Built with AI coding sessions under my direction.
Timeline
September 2026
Built with
  • Figma
  • Claude Code
  • Storybook
Stack
  • React 18
  • React Router 7
  • TanStack Query
  • zod
  • Tailwind CSS 4
  • Base UI
  • Motion
  • Storybook
  • MongoDB
01

One Platform for Six Business Simulations

6simulations behind one login and one Admin
24routes in the one Admin
867design tokens, in three tiers
105components, with 231 stories
851Admin tests in the last recorded run (29 September 2026)
105 of 105contract steps against the real servers
460commits in 5 days and 17 hours
0files importing MUI in the Admin

Stratagem runs business war games. Teams submit decisions each round, and an engine ranks them against each other. The old product was one admin copied four times inside a rail of iframes, with access that had a model but no screen, and a look scattered across 238 colour literals per client. The brief: a big change to the UI and the Admin first, with logic, formulas and inputs untouched. V2 answers with one platform, one Admin and one design system. It is deployed and live in production.

  • One sign-in for staff, and a passkey alone for teams.
  • Four copied admins and an iframe console, replaced by one Admin with 24 routes.
  • Engine numbers never move by accident: replays are the proof.
  • Designed by hand in Figma, built with Claude Code, and delivered as Storybook components.
01 · VideoThe story of one round: set up, played, ended and computed
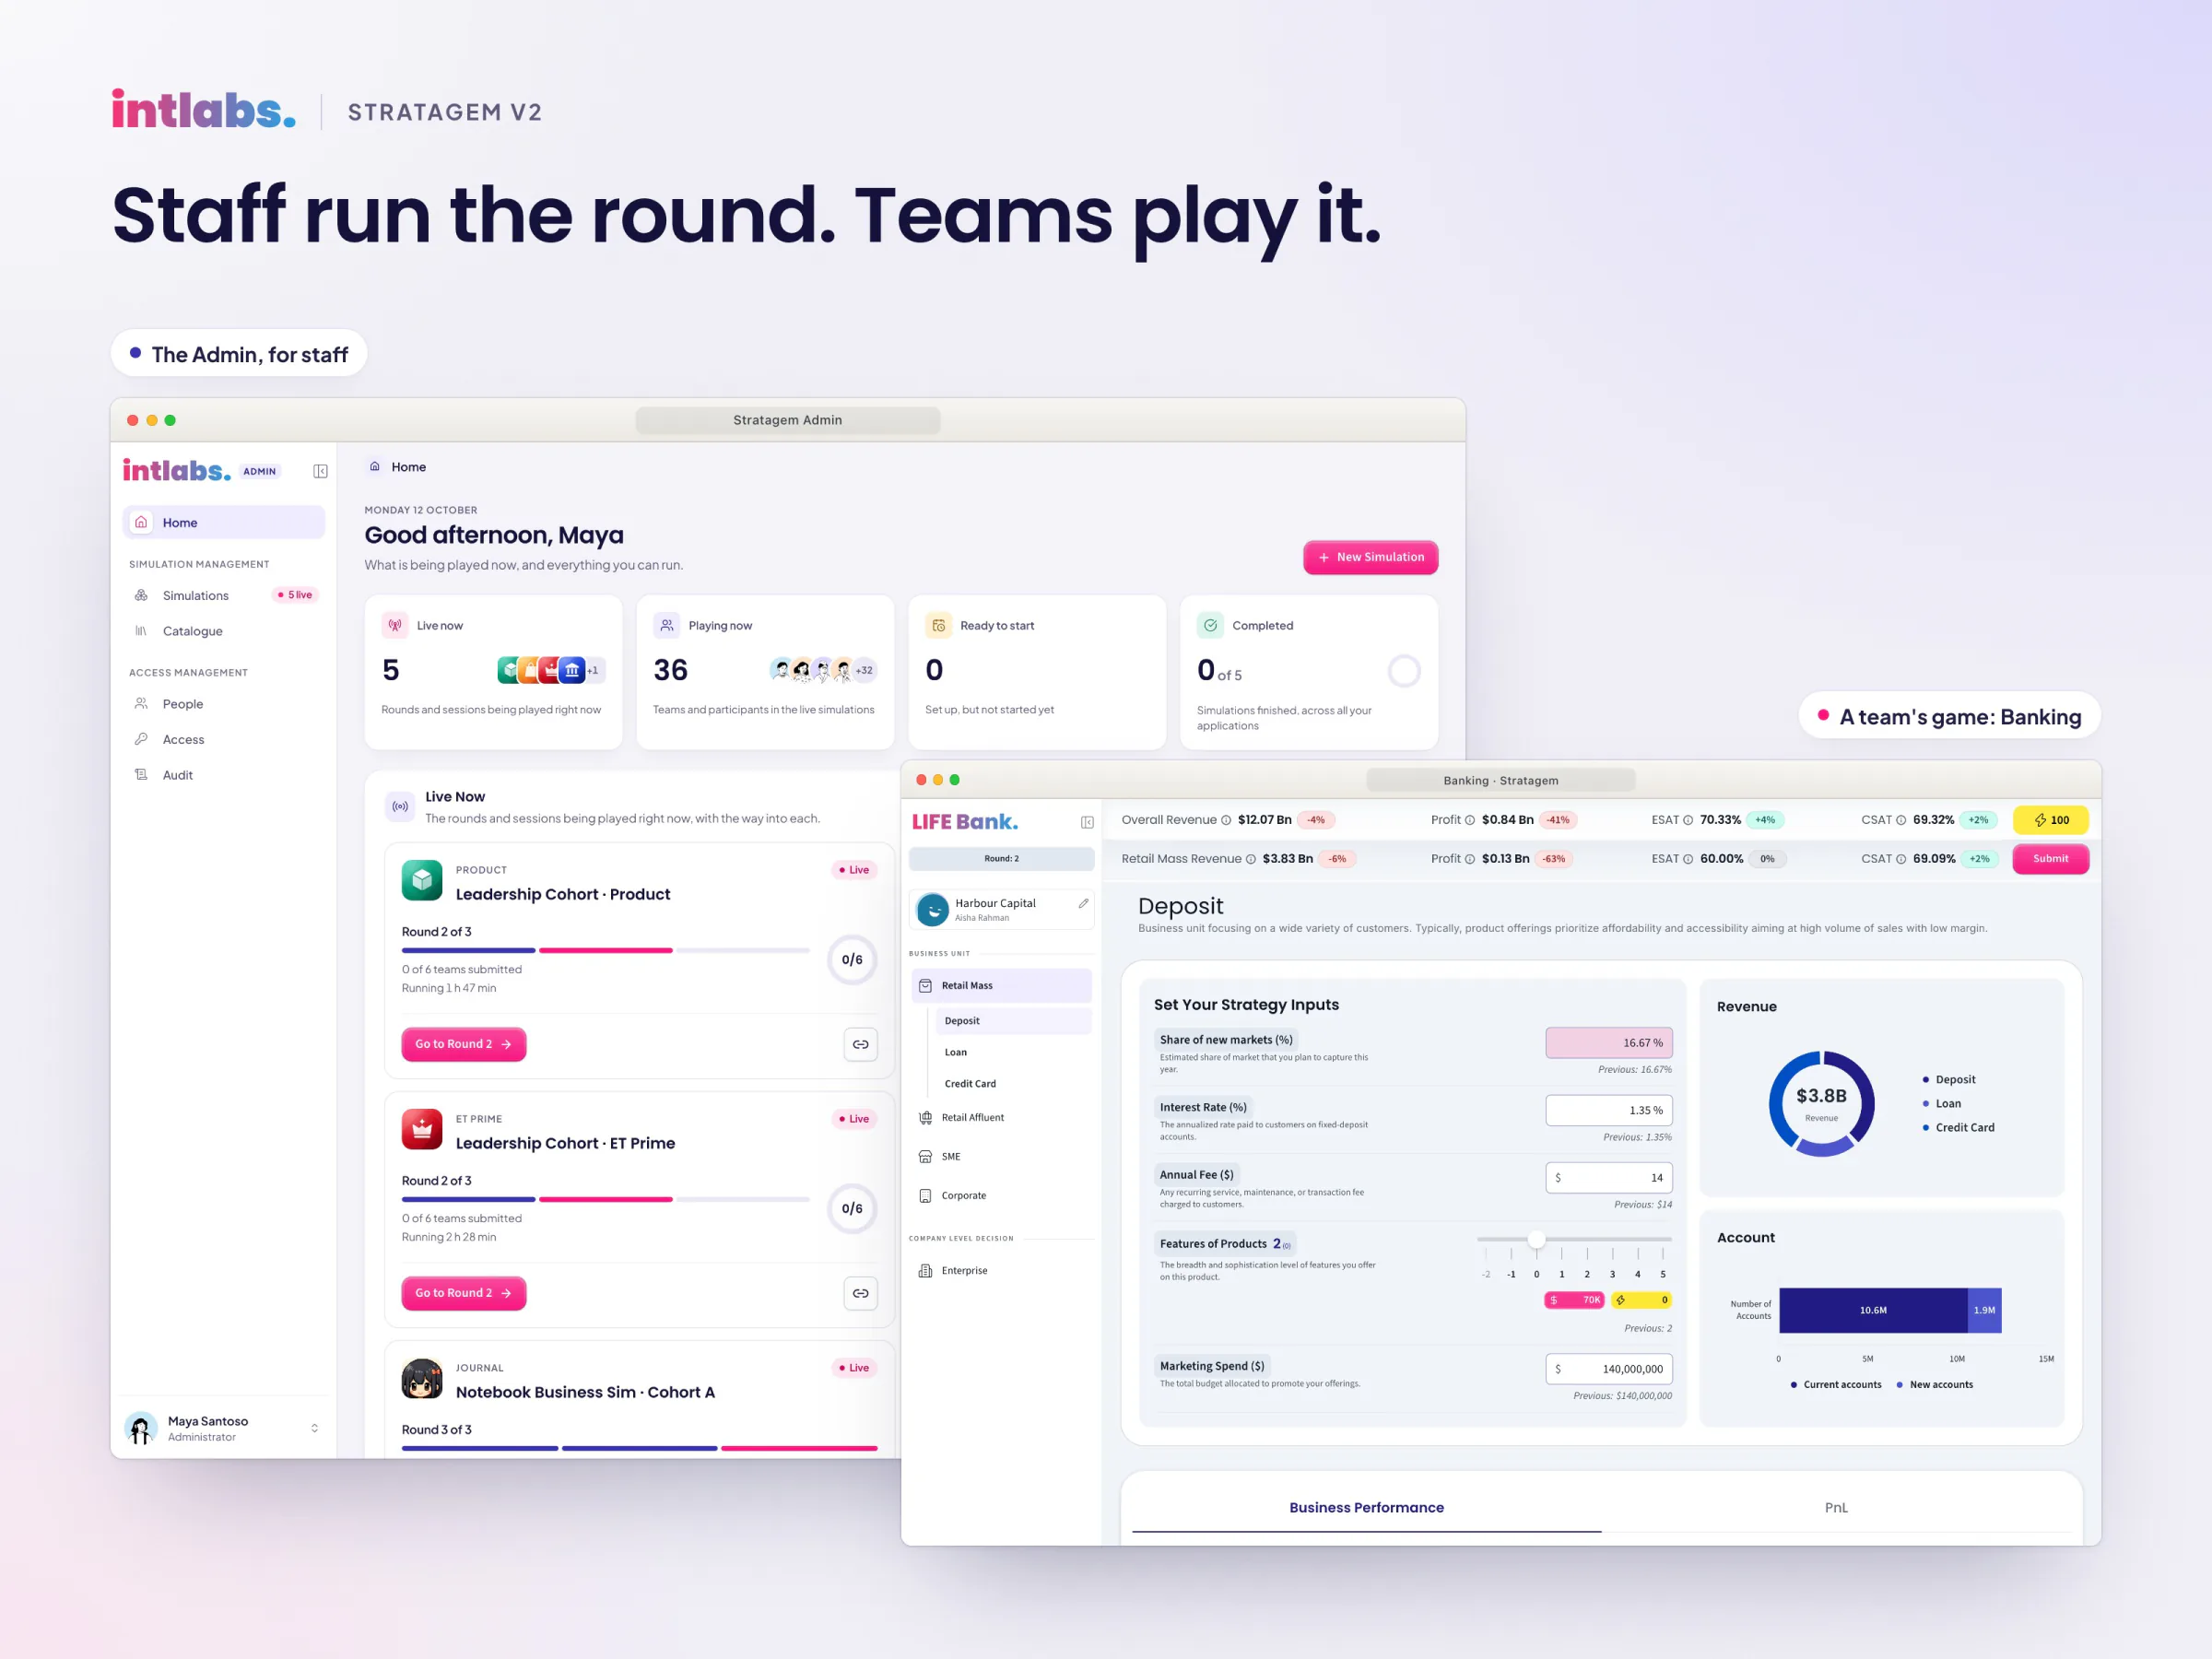
Two browser windows overlapping under "Staff run the round. Teams play it.": the Admin's Home, and a team's Banking game.
02Staff run the round. Teams play it.
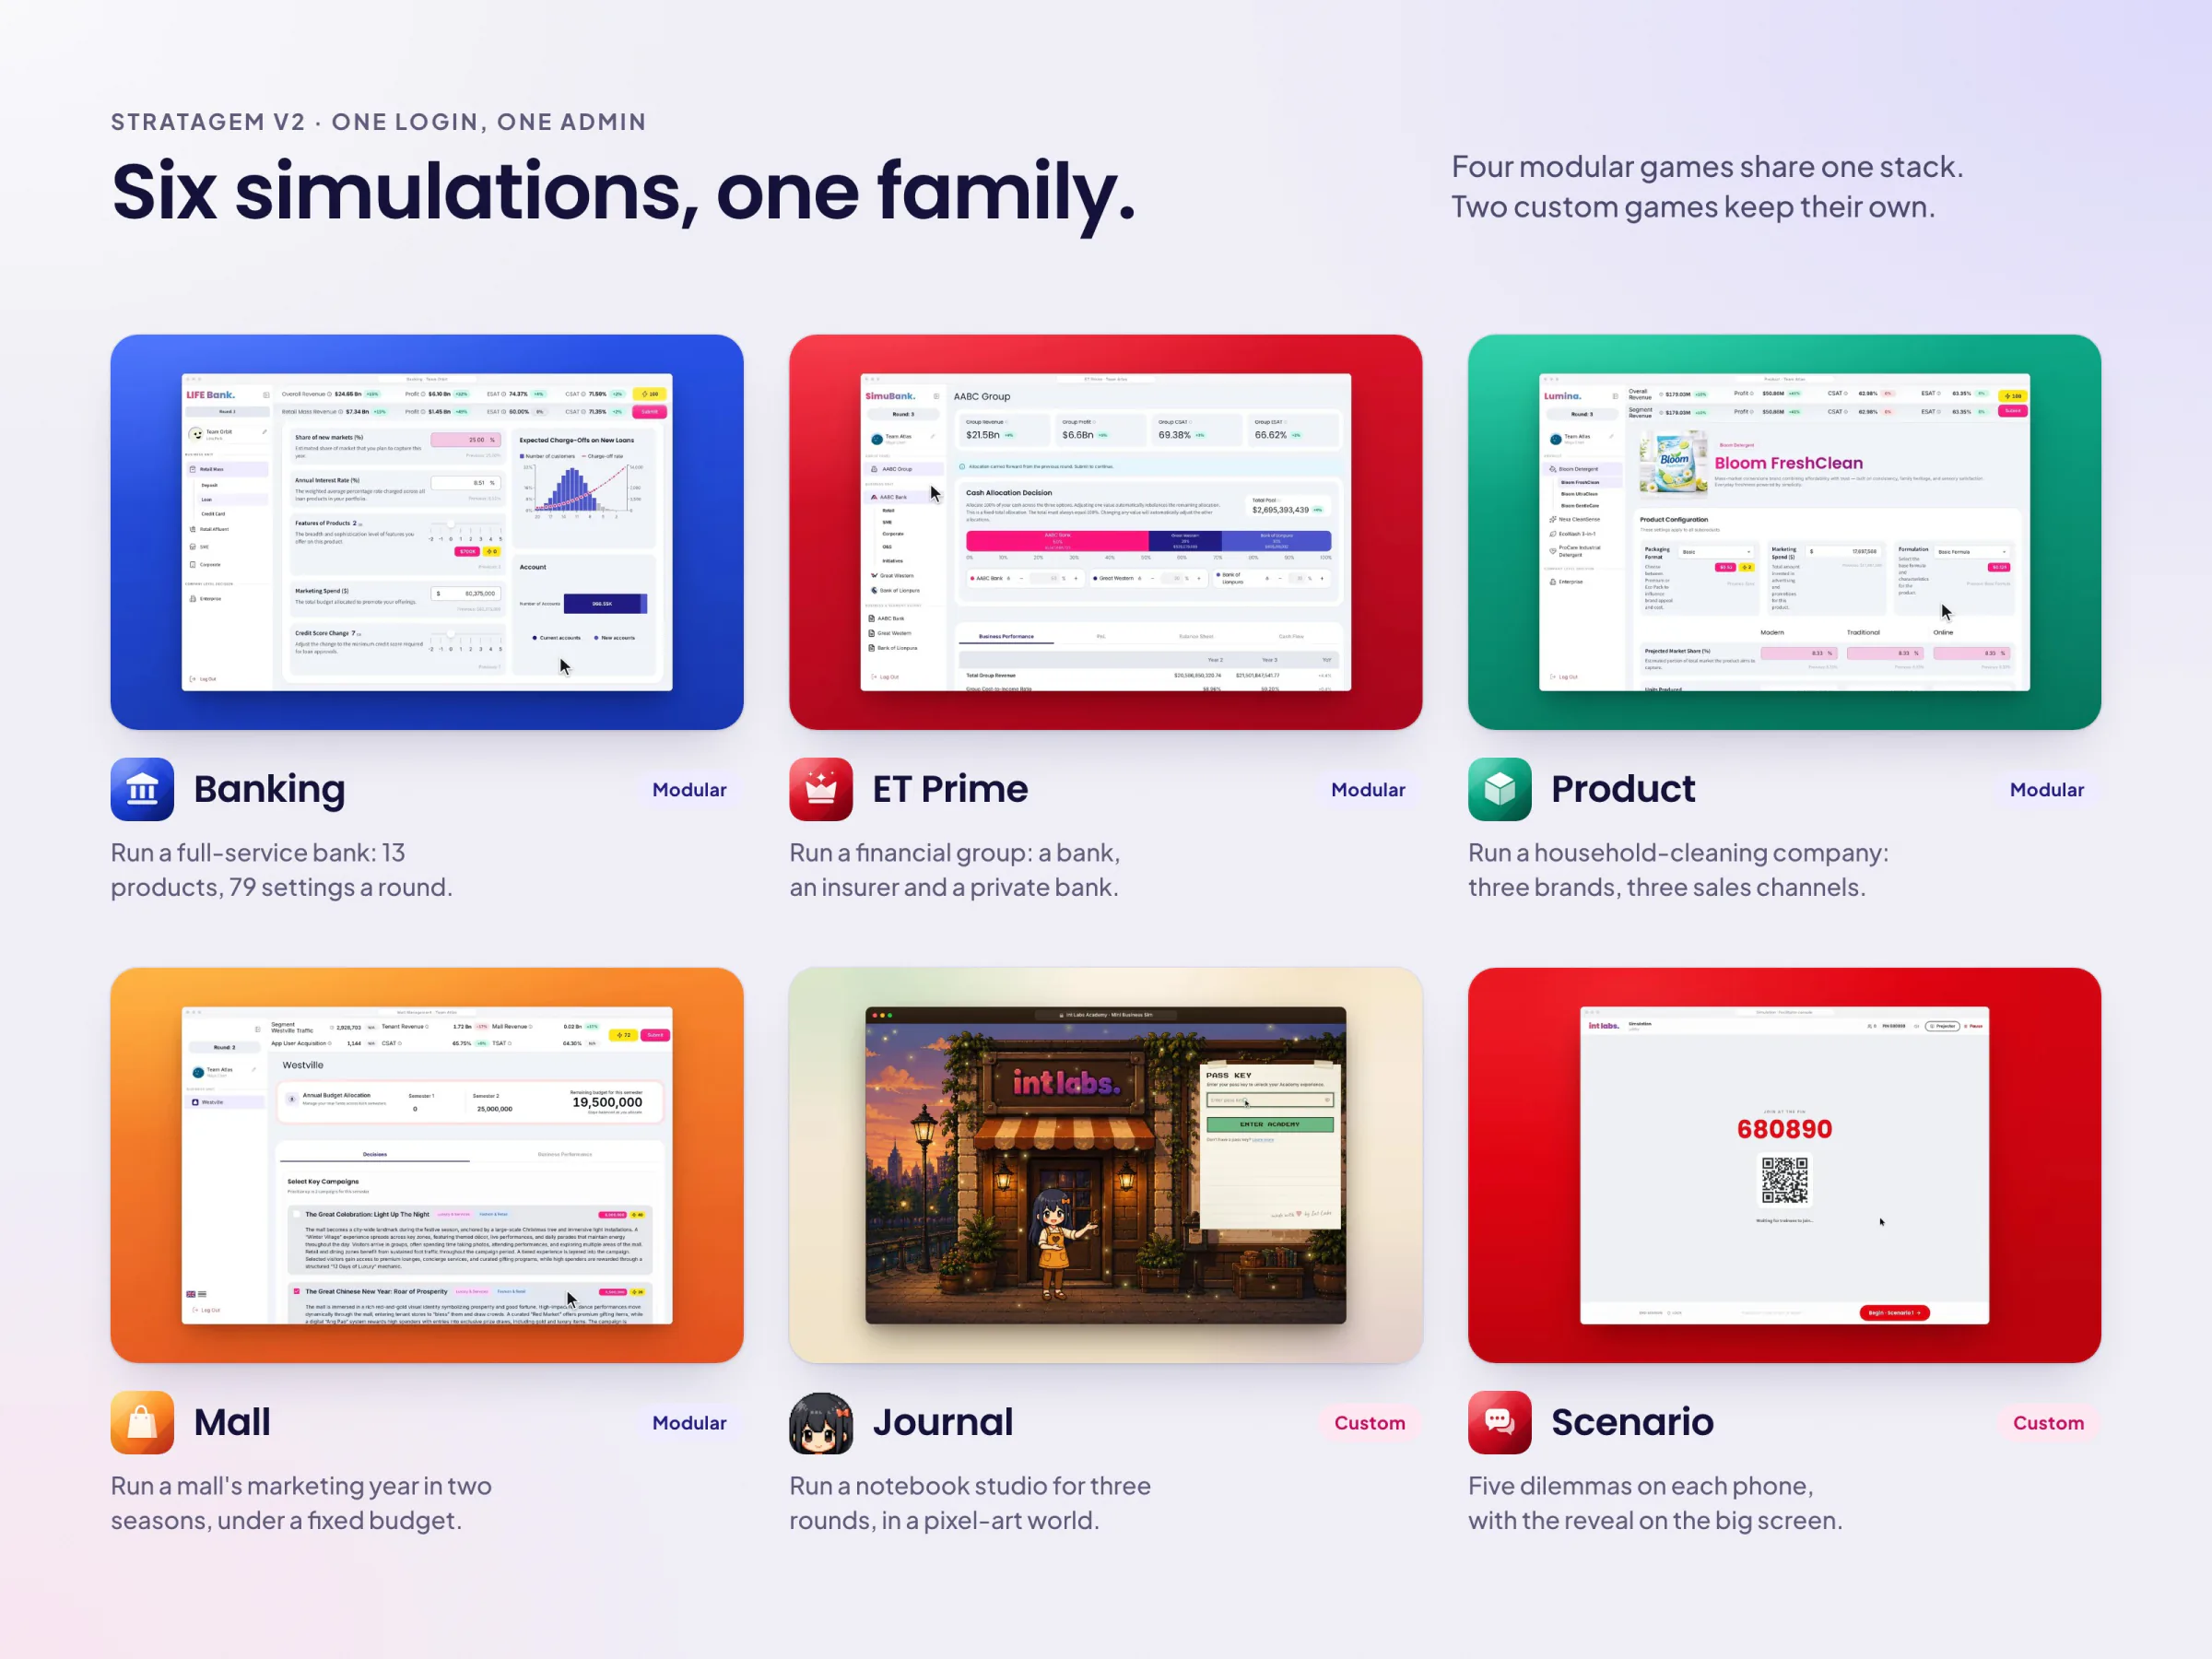
Six game covers under "Six simulations, one family.": Banking, ET Prime, Product and Mall marked modular; Journal and Scenario marked custom.
03Six simulations, one family: four modular, two custom
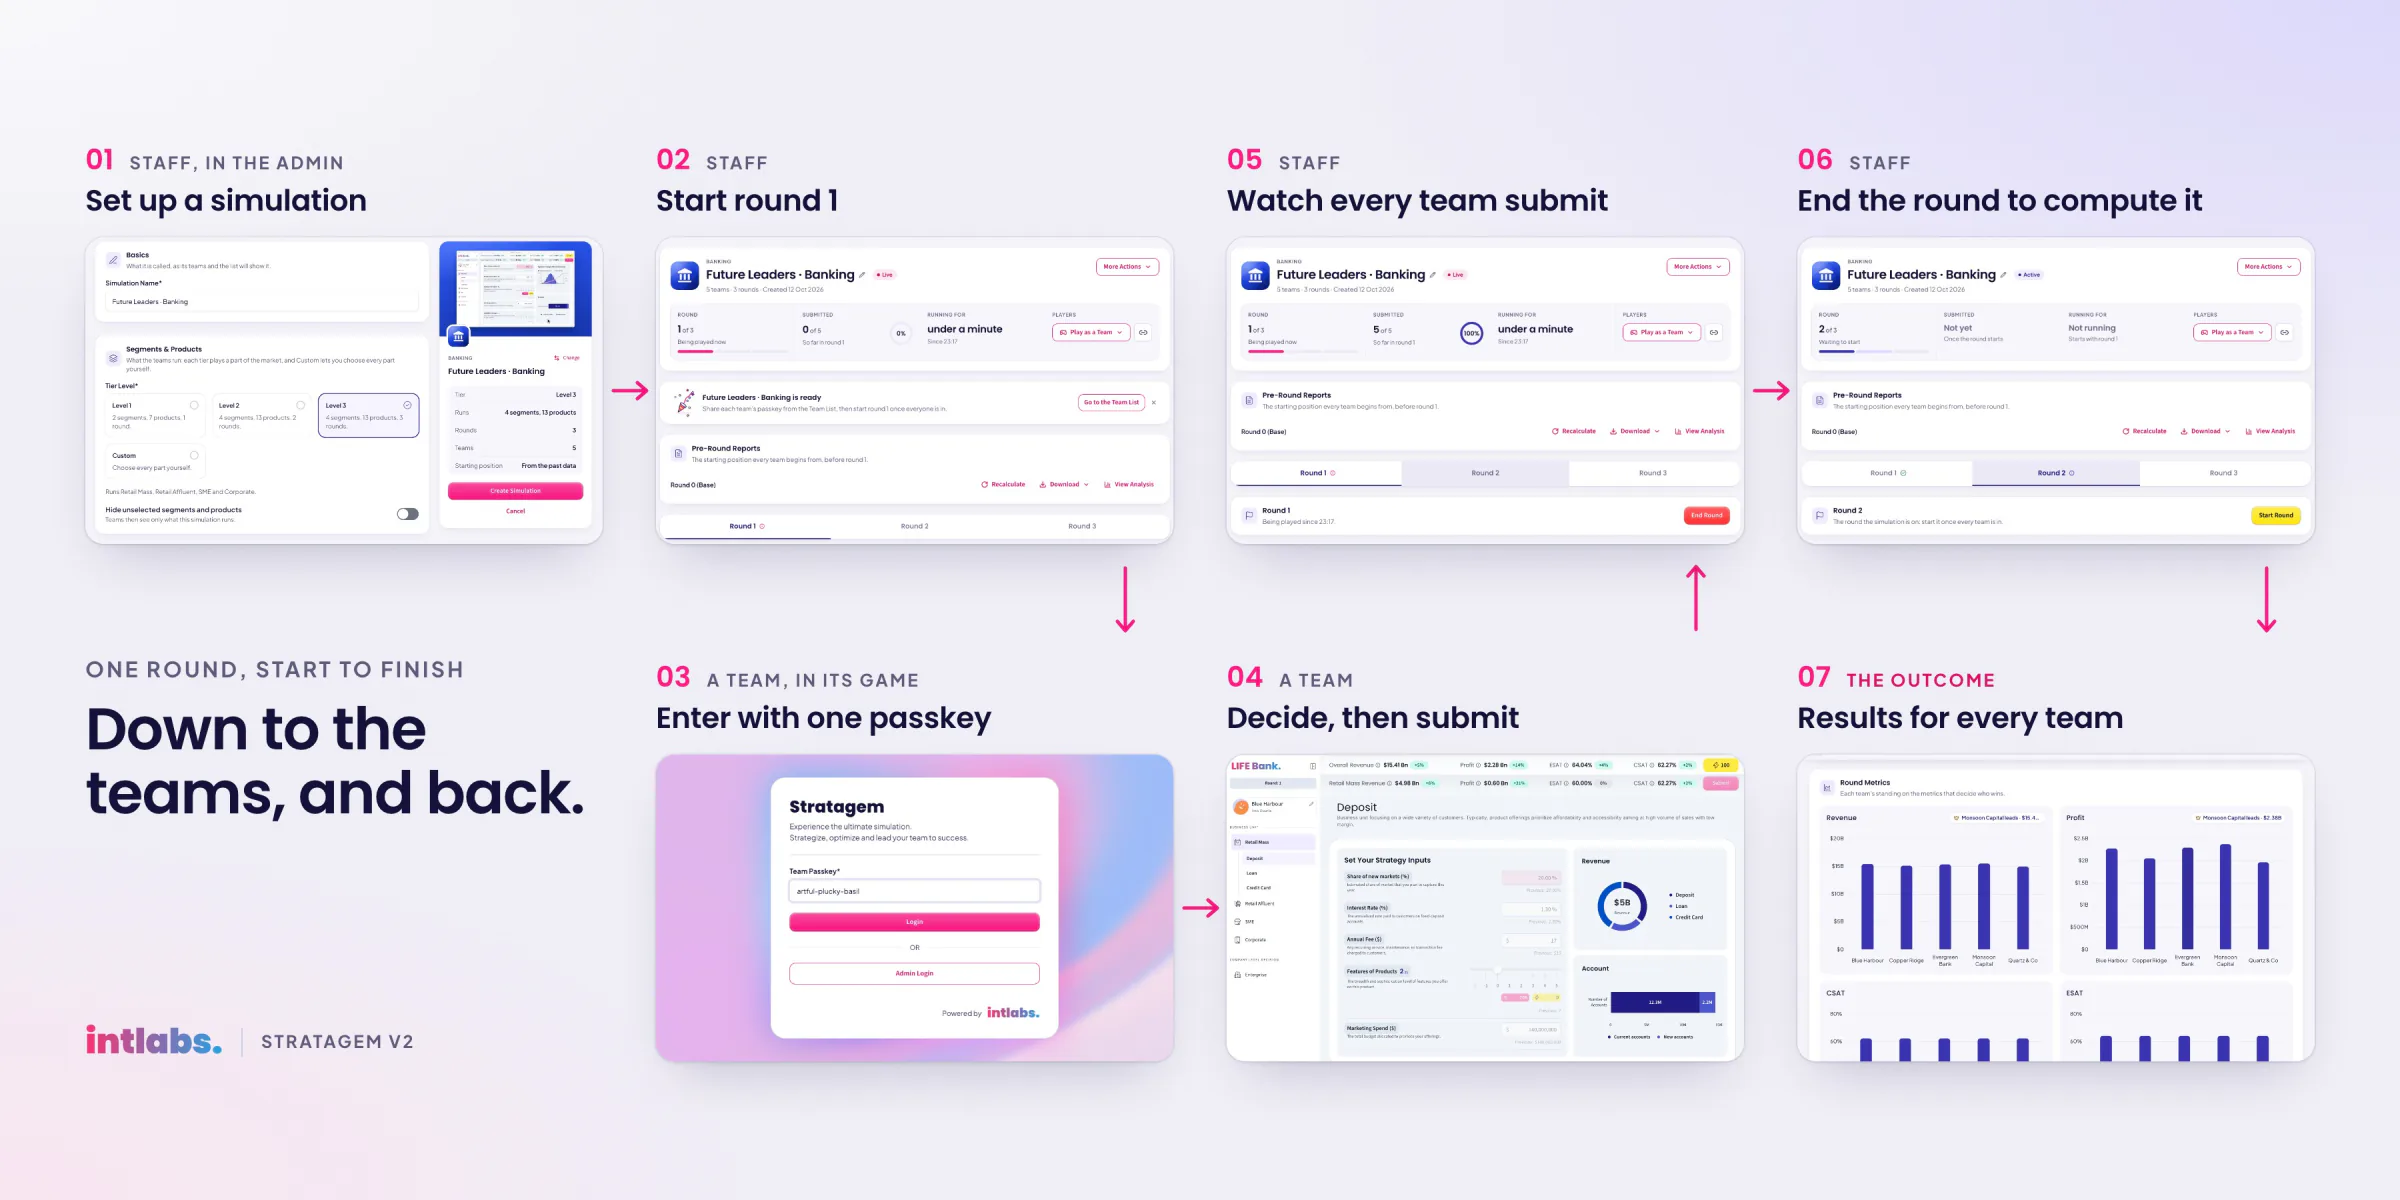
A wide banner, "Down to the teams, and back.": seven numbered pictures from setting up a simulation to results for every team.
04Down to the teams, and back
02

One Admin for Every Simulation

A staff member chooses a simulation from a gallery, sets it up on one page, and hands out passkeys as a copy, a CSV or printed cards. From the simulation's page they start a round, watch each team submit live, and end the round, which computes it. Results come as a chart per winning metric, Excel reports and each team's decisions. Administrators also manage people, give access per application or per simulation until a date, and read an audit log written in words. The look stays light and flat, and covers play only on hover.

  • One adapter reads all four modular servers; its contract test passed 105 of 105 steps.
  • The front door: a passkey alone, looked up in five applications at once.
  • Grants with dates, checked on every request and never deleted.
  • Every Admin screen is assembled from the design system's Storybook components.
05 · VideoA tour of the Admin, from Home to the audit log
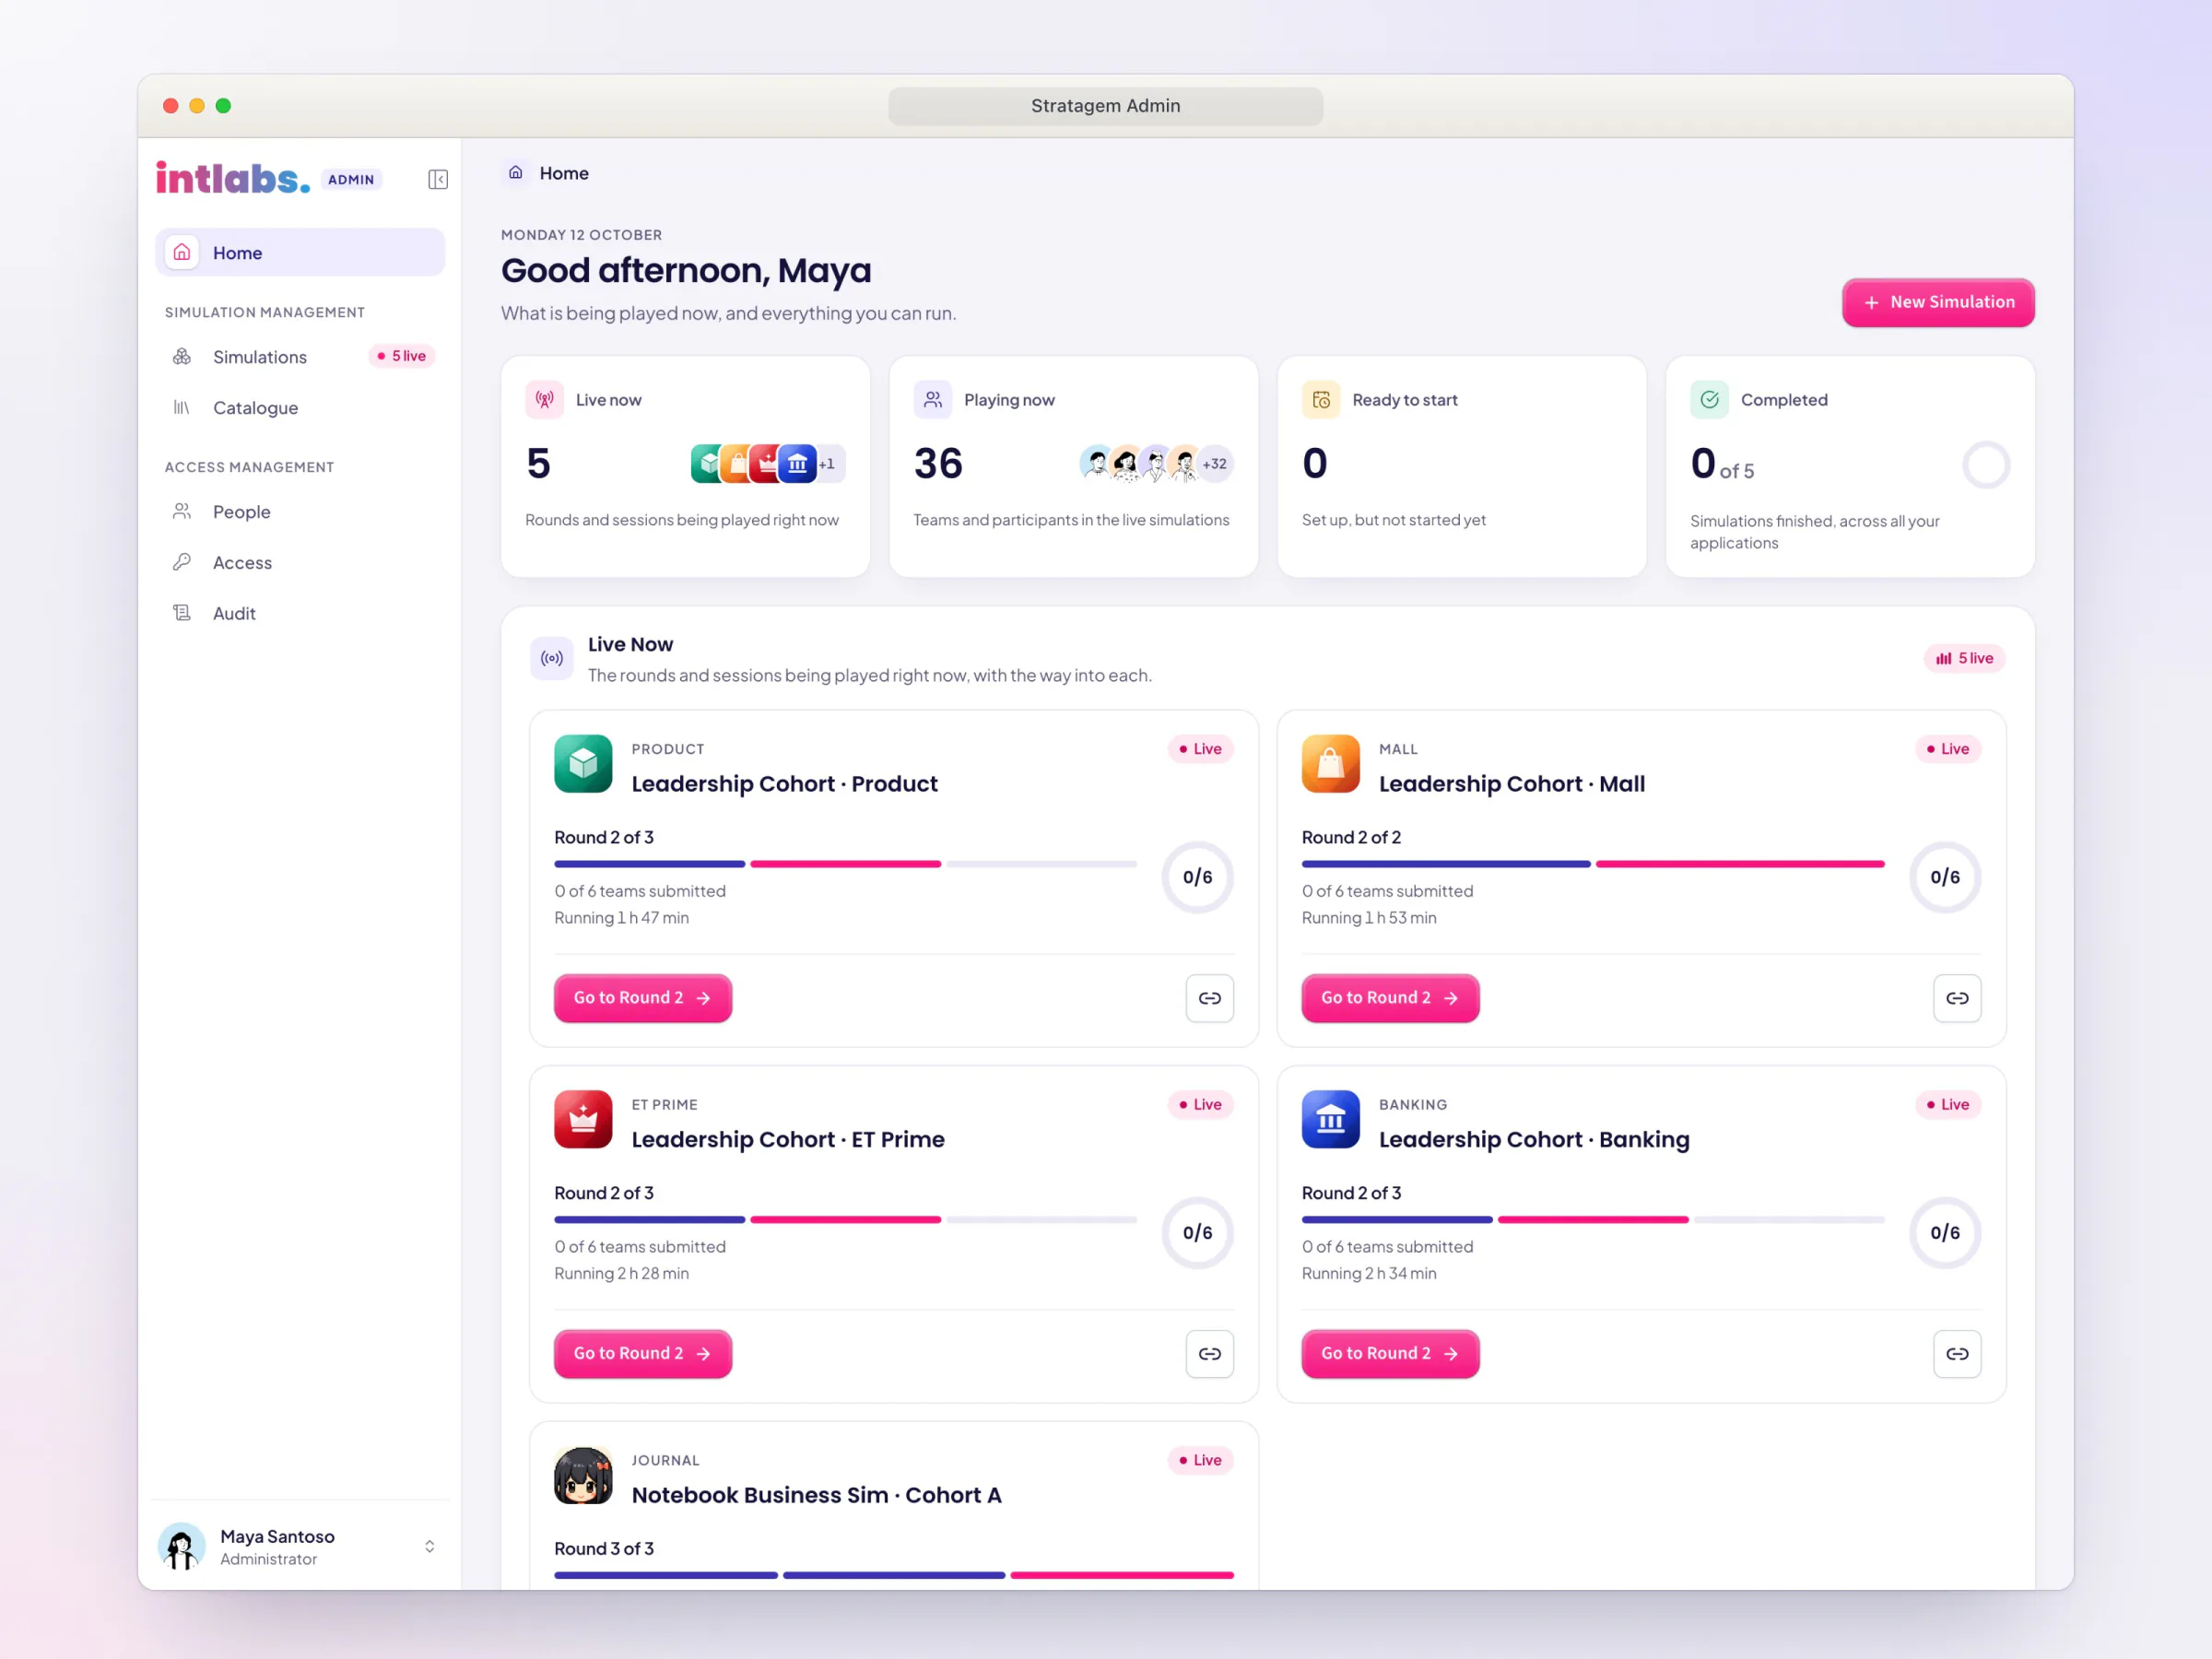
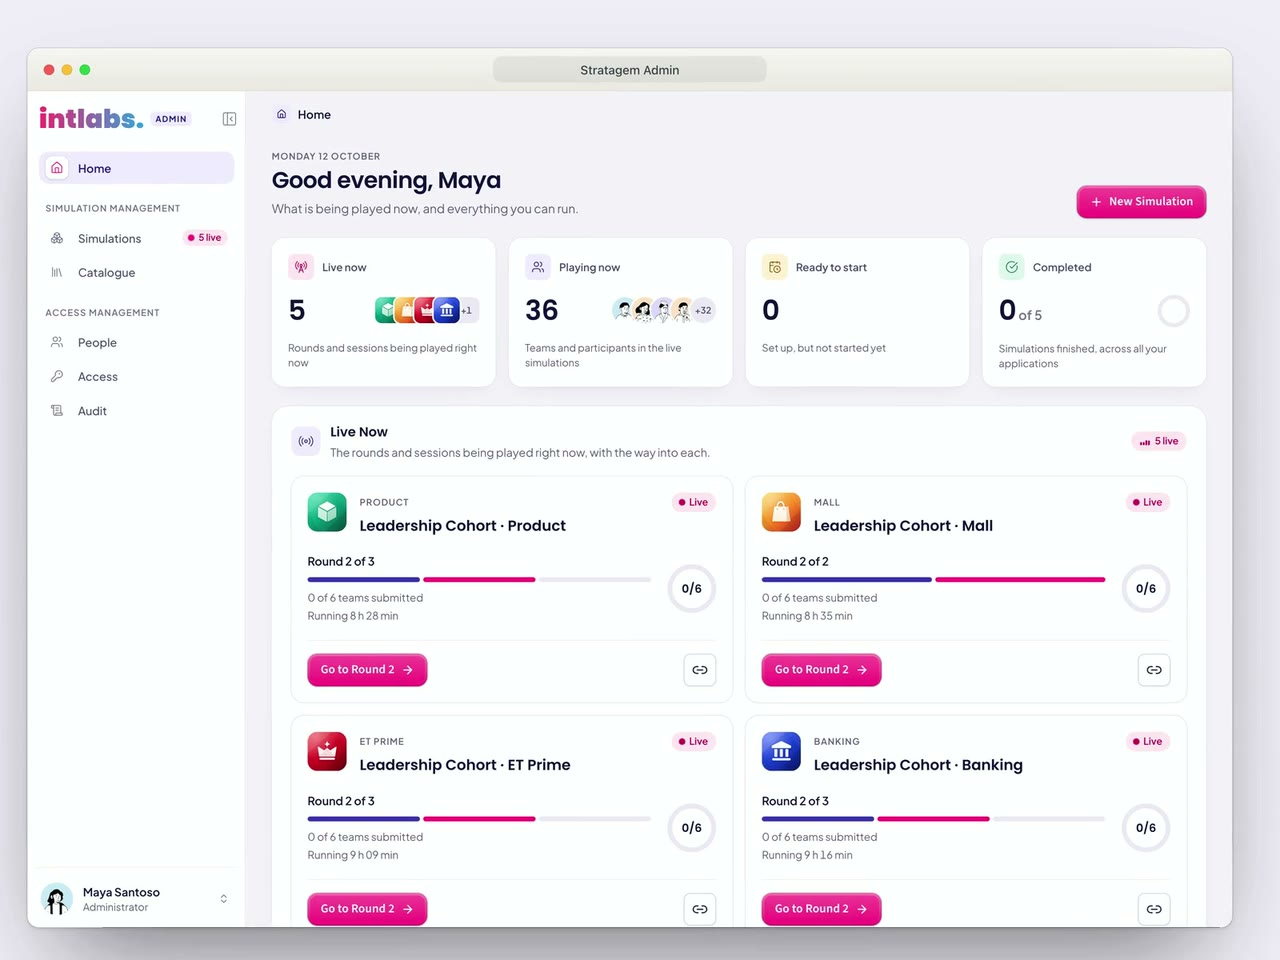
One browser window showing the Admin's Home: 5 live, 36 playing, 0 ready to start, 0 of 5 completed, and Live Now cards.
06The Admin's Home in one browser window
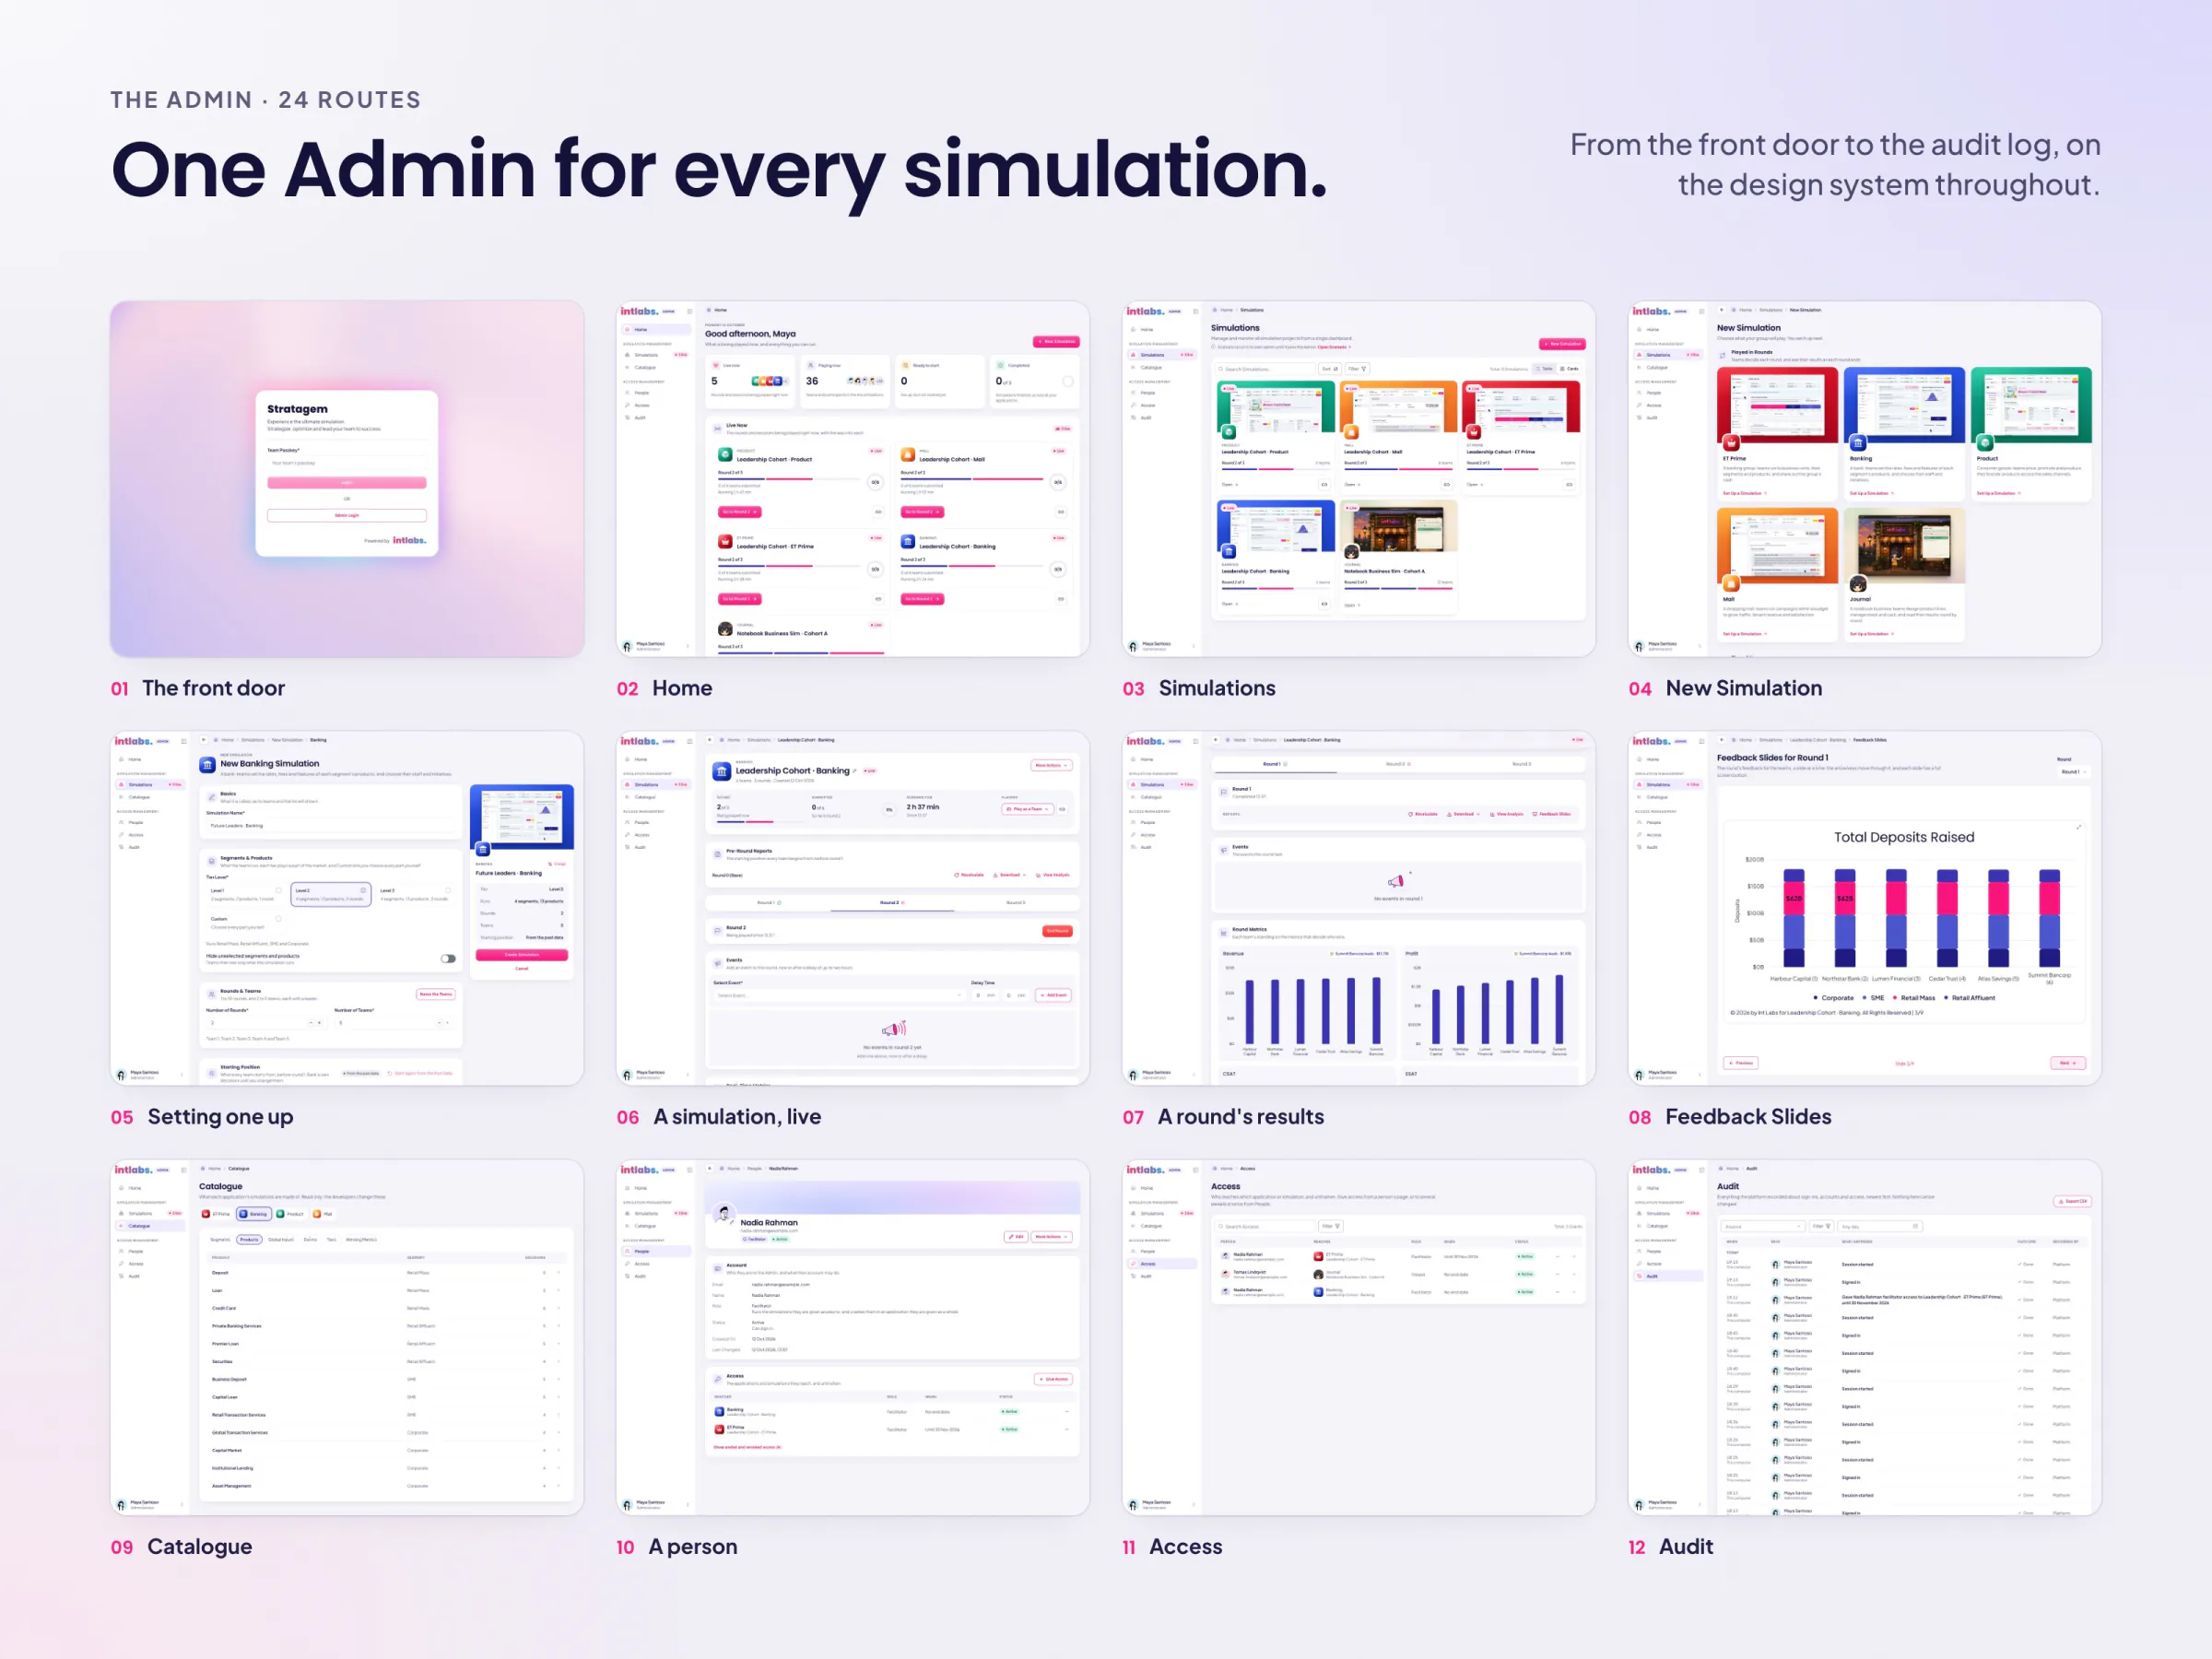
Twelve small pages of the Admin in a grid, numbered from the front door to the audit log, under "One Admin for every simulation."
07Twelve pages, from the front door to the audit log
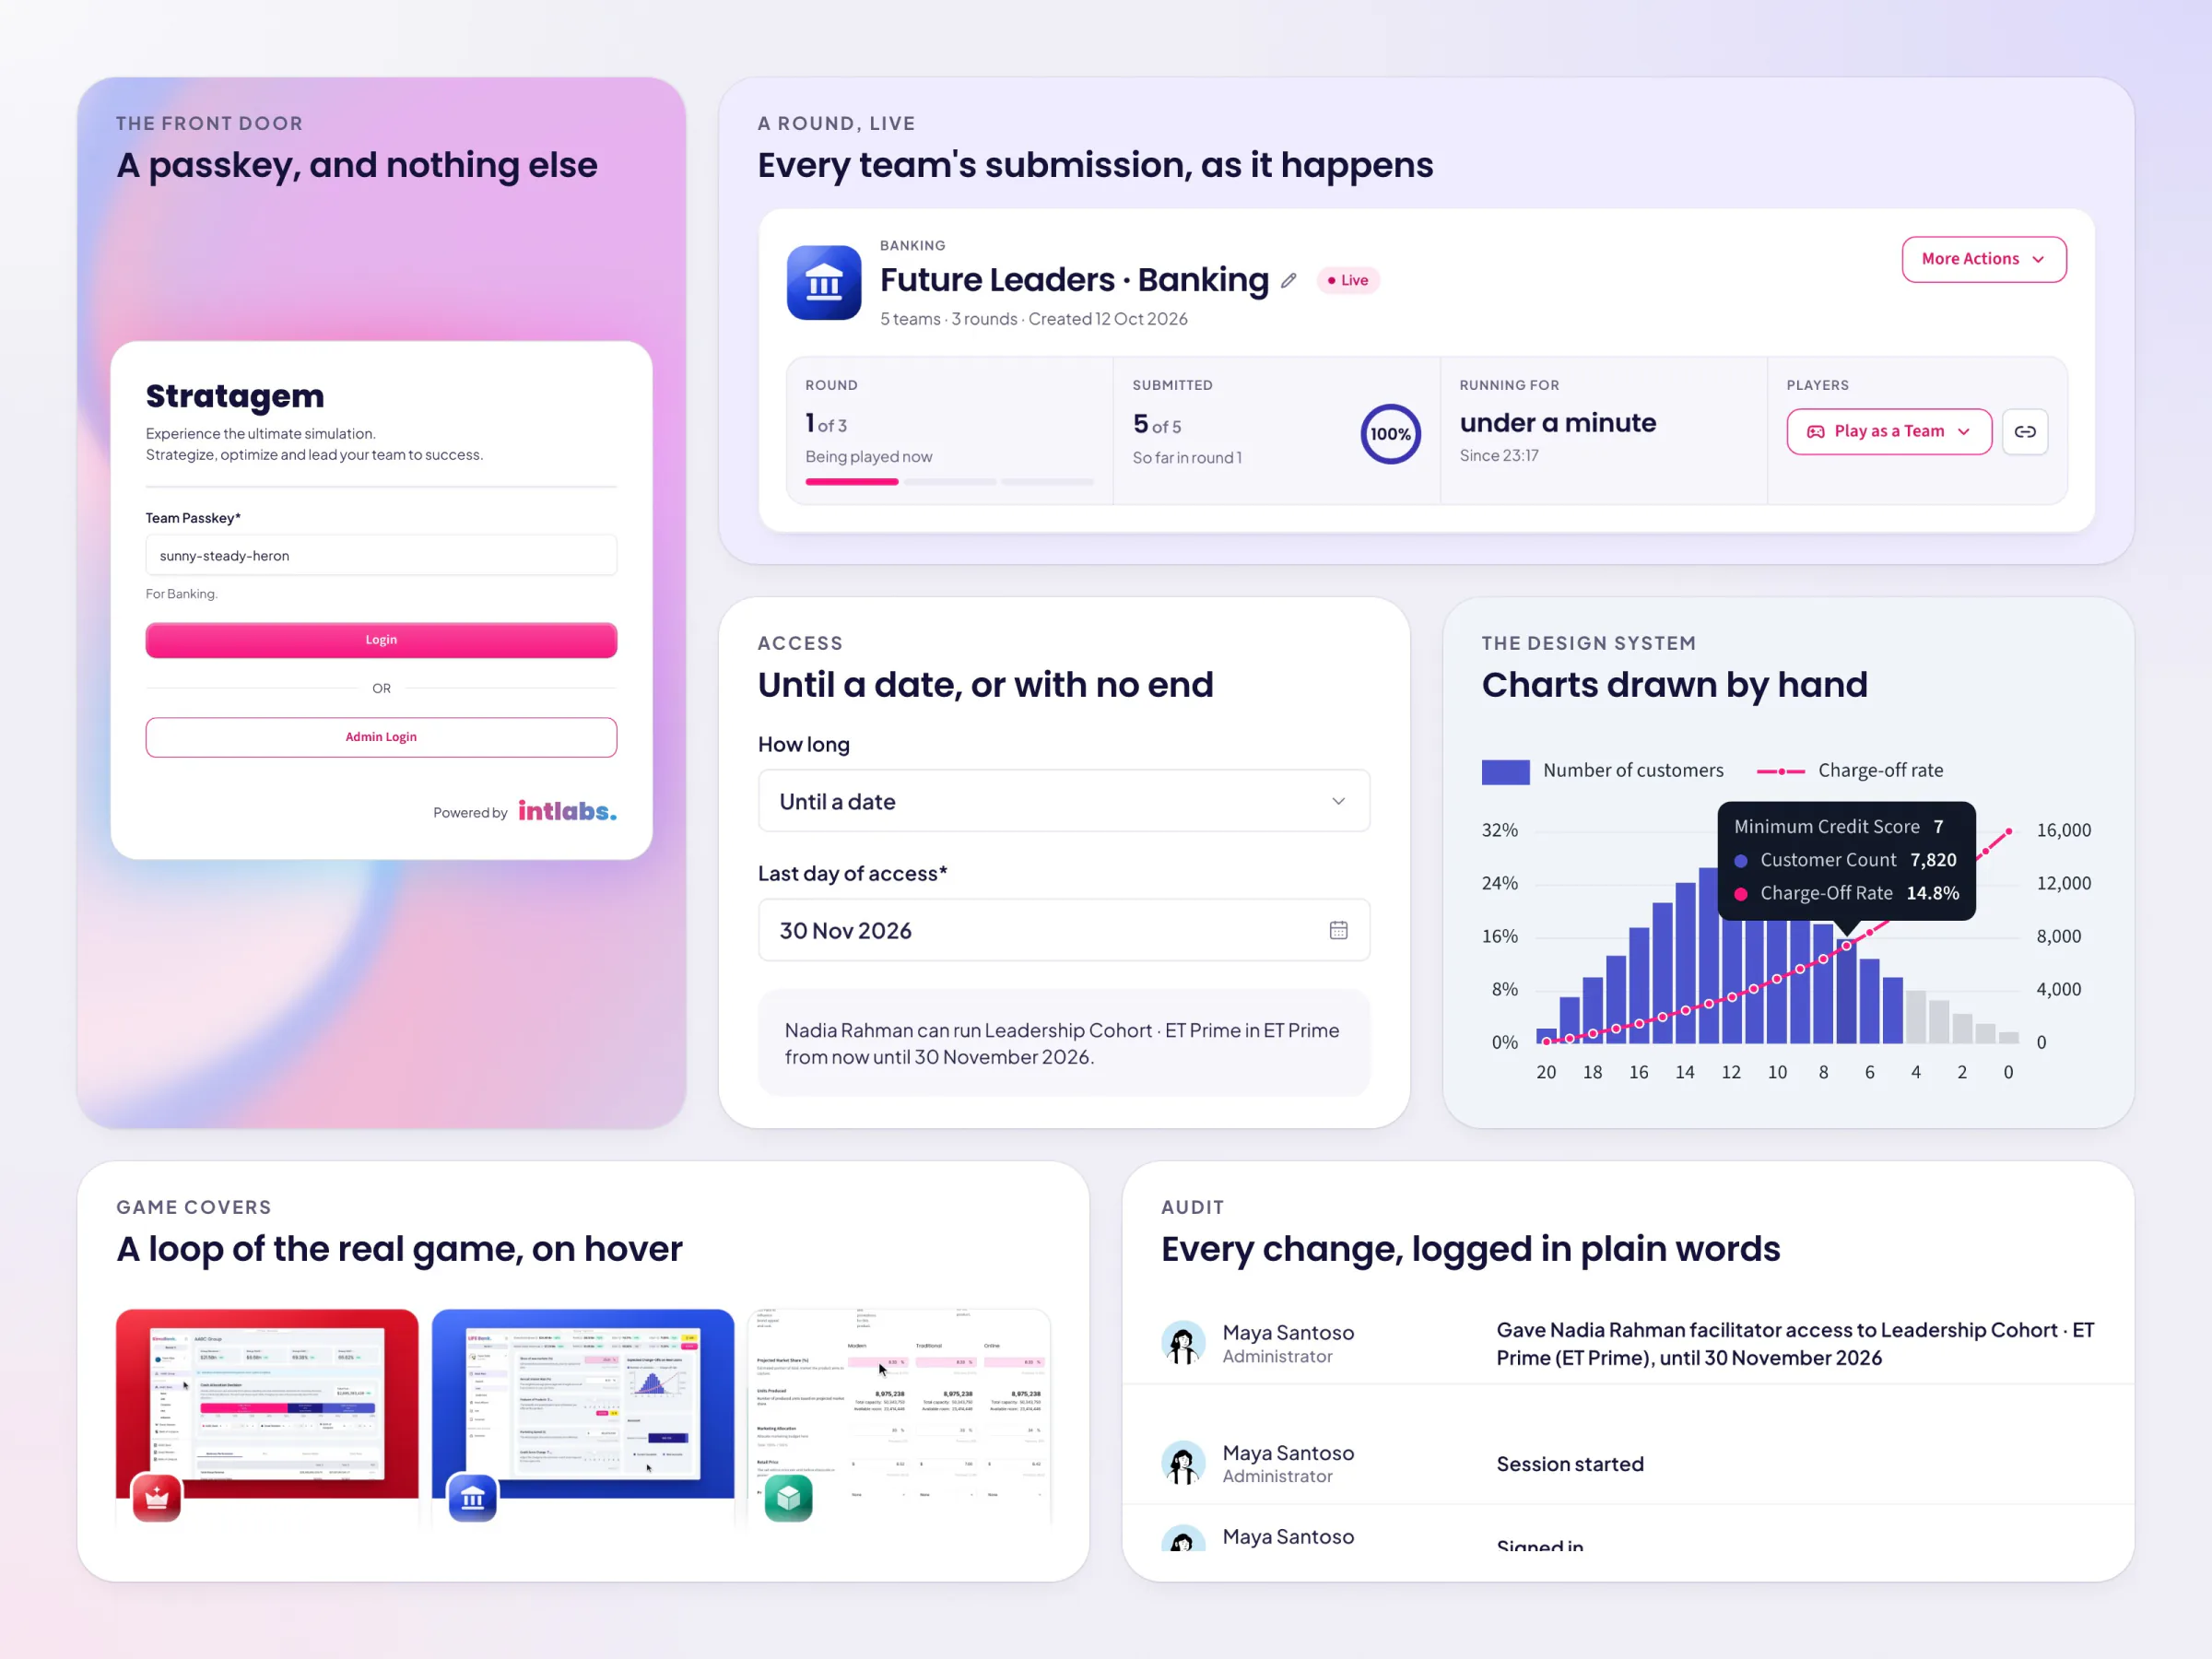
Six tiles: a passkey card, a round with 5 of 5 submitted, an access date, a chart, game covers, and audit log lines.
08Six details: the front door, a round live, access until a date, a hand-drawn chart, game covers, the audit log
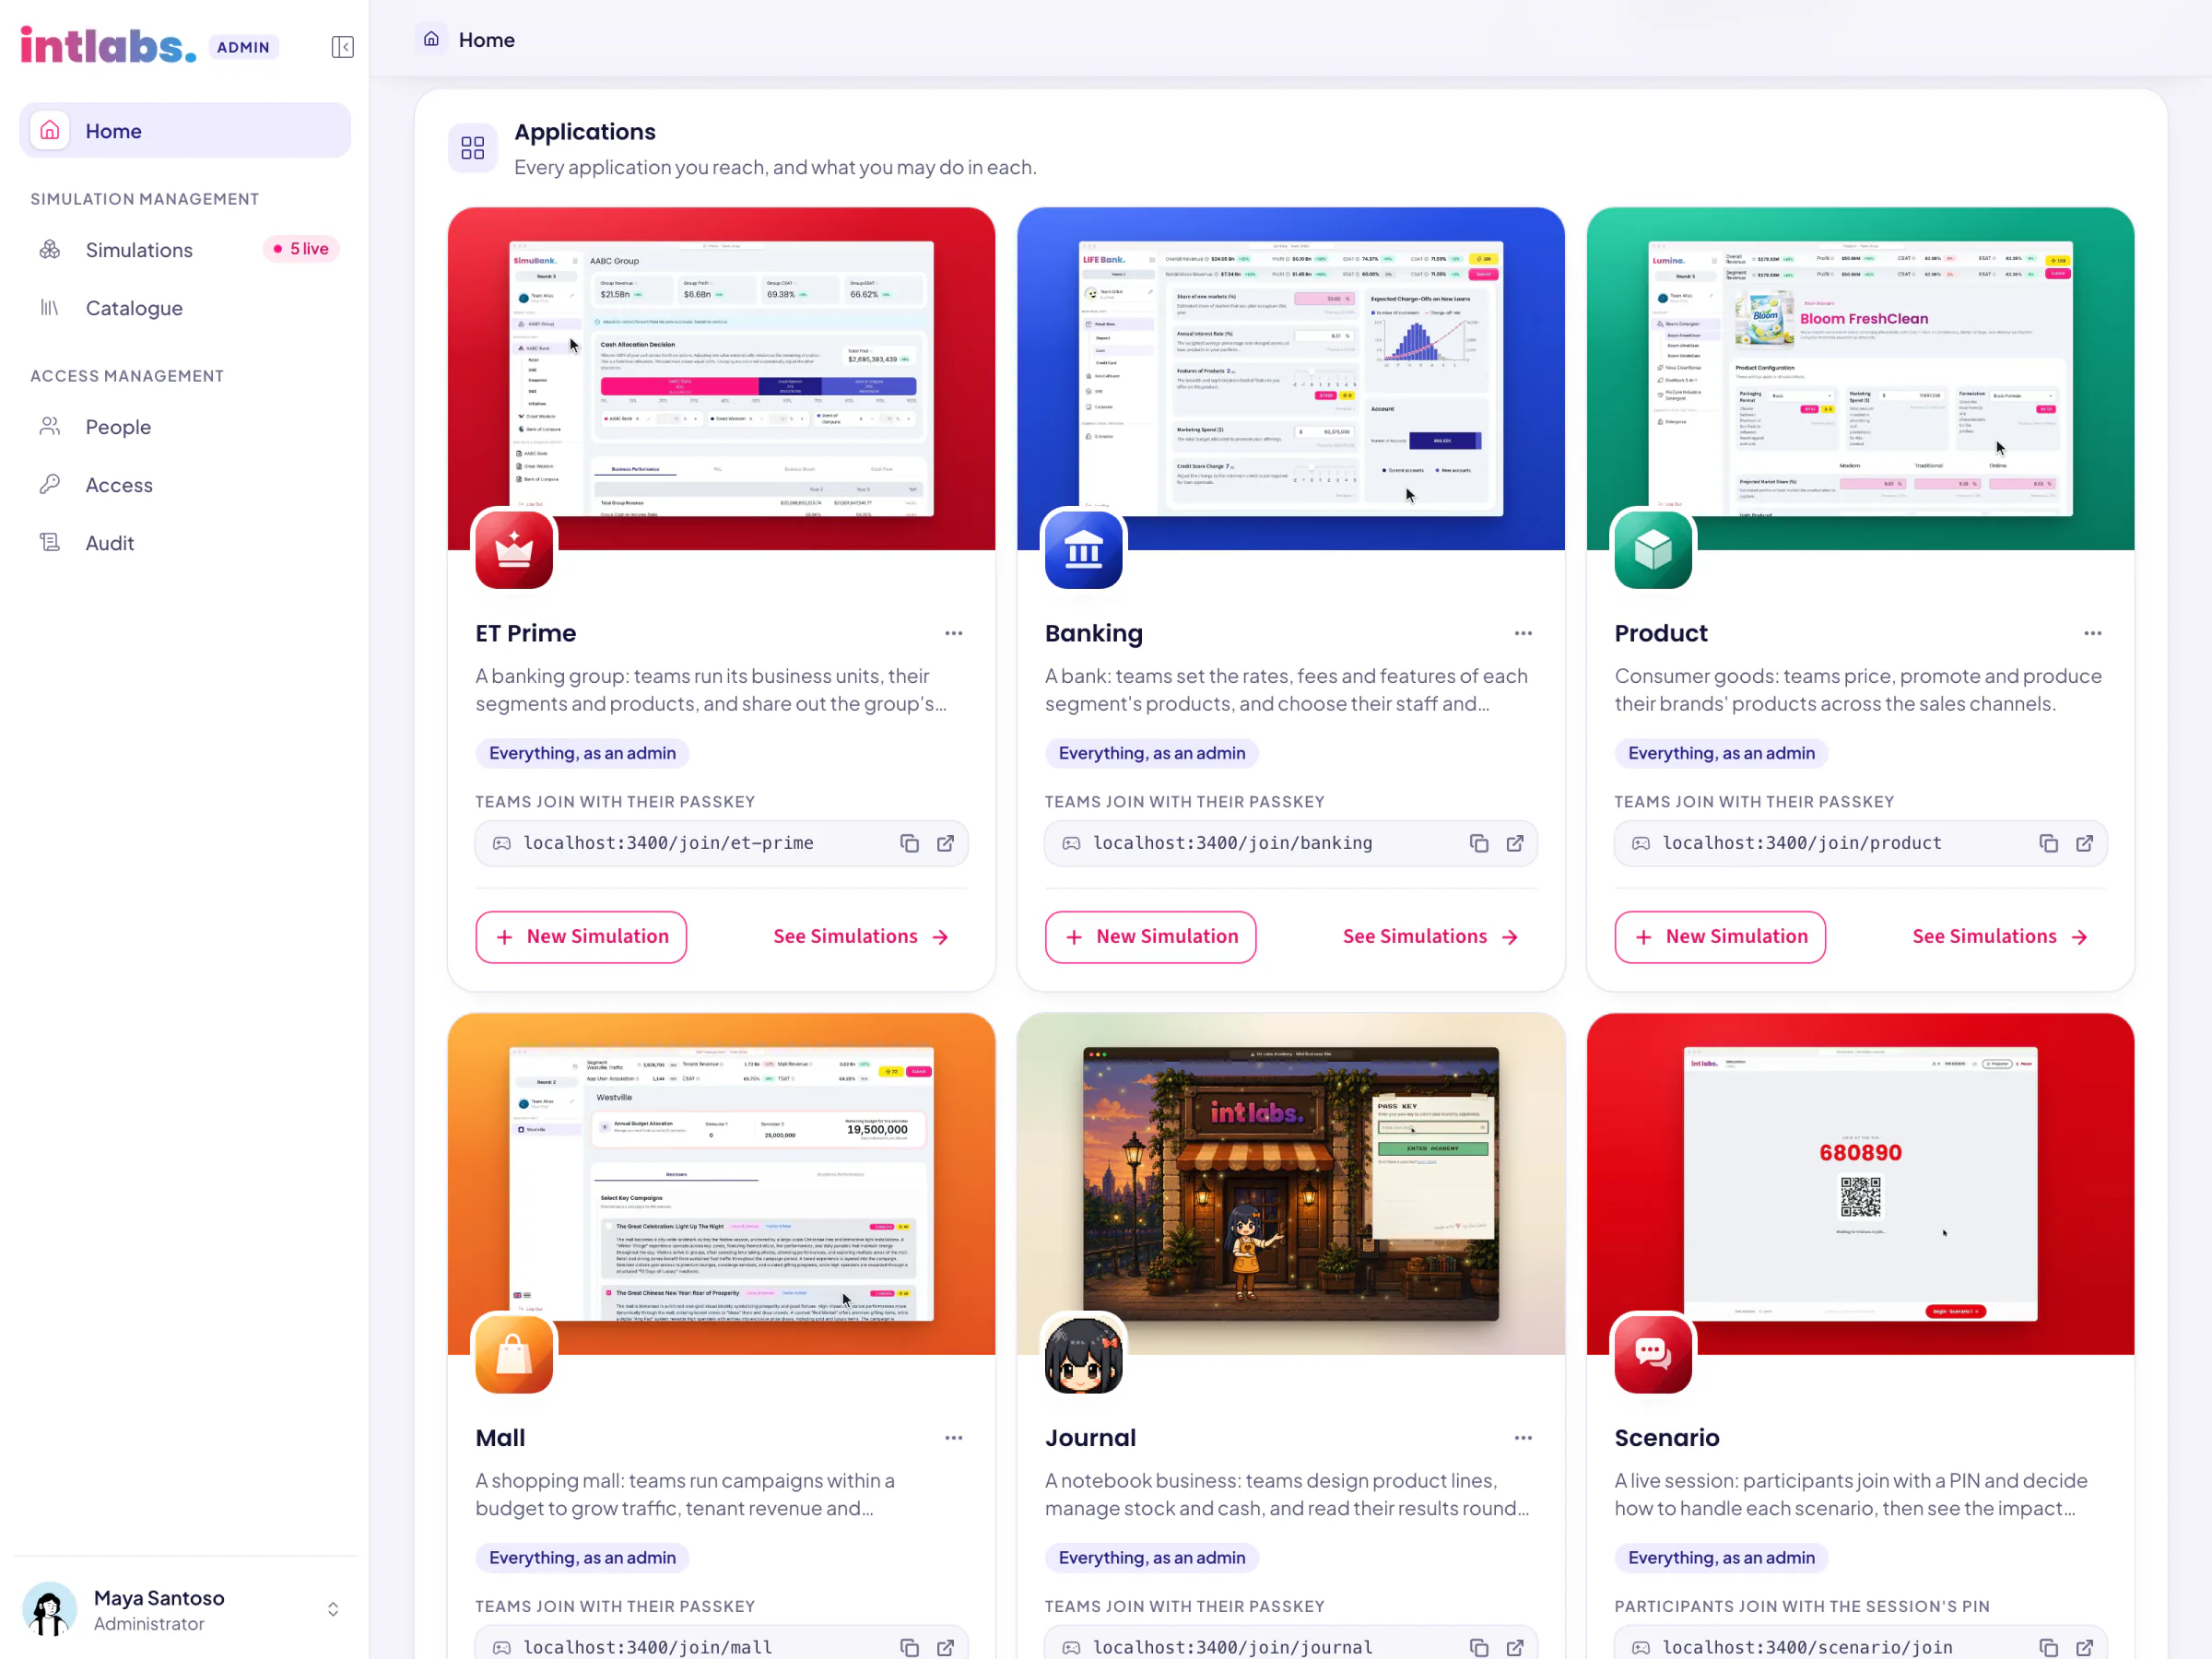
Six application cards with game covers: ET Prime, Banking, Product, Mall, Journal and Scenario, each with a join address and two actions.
09The gallery: six applications, each with its join address
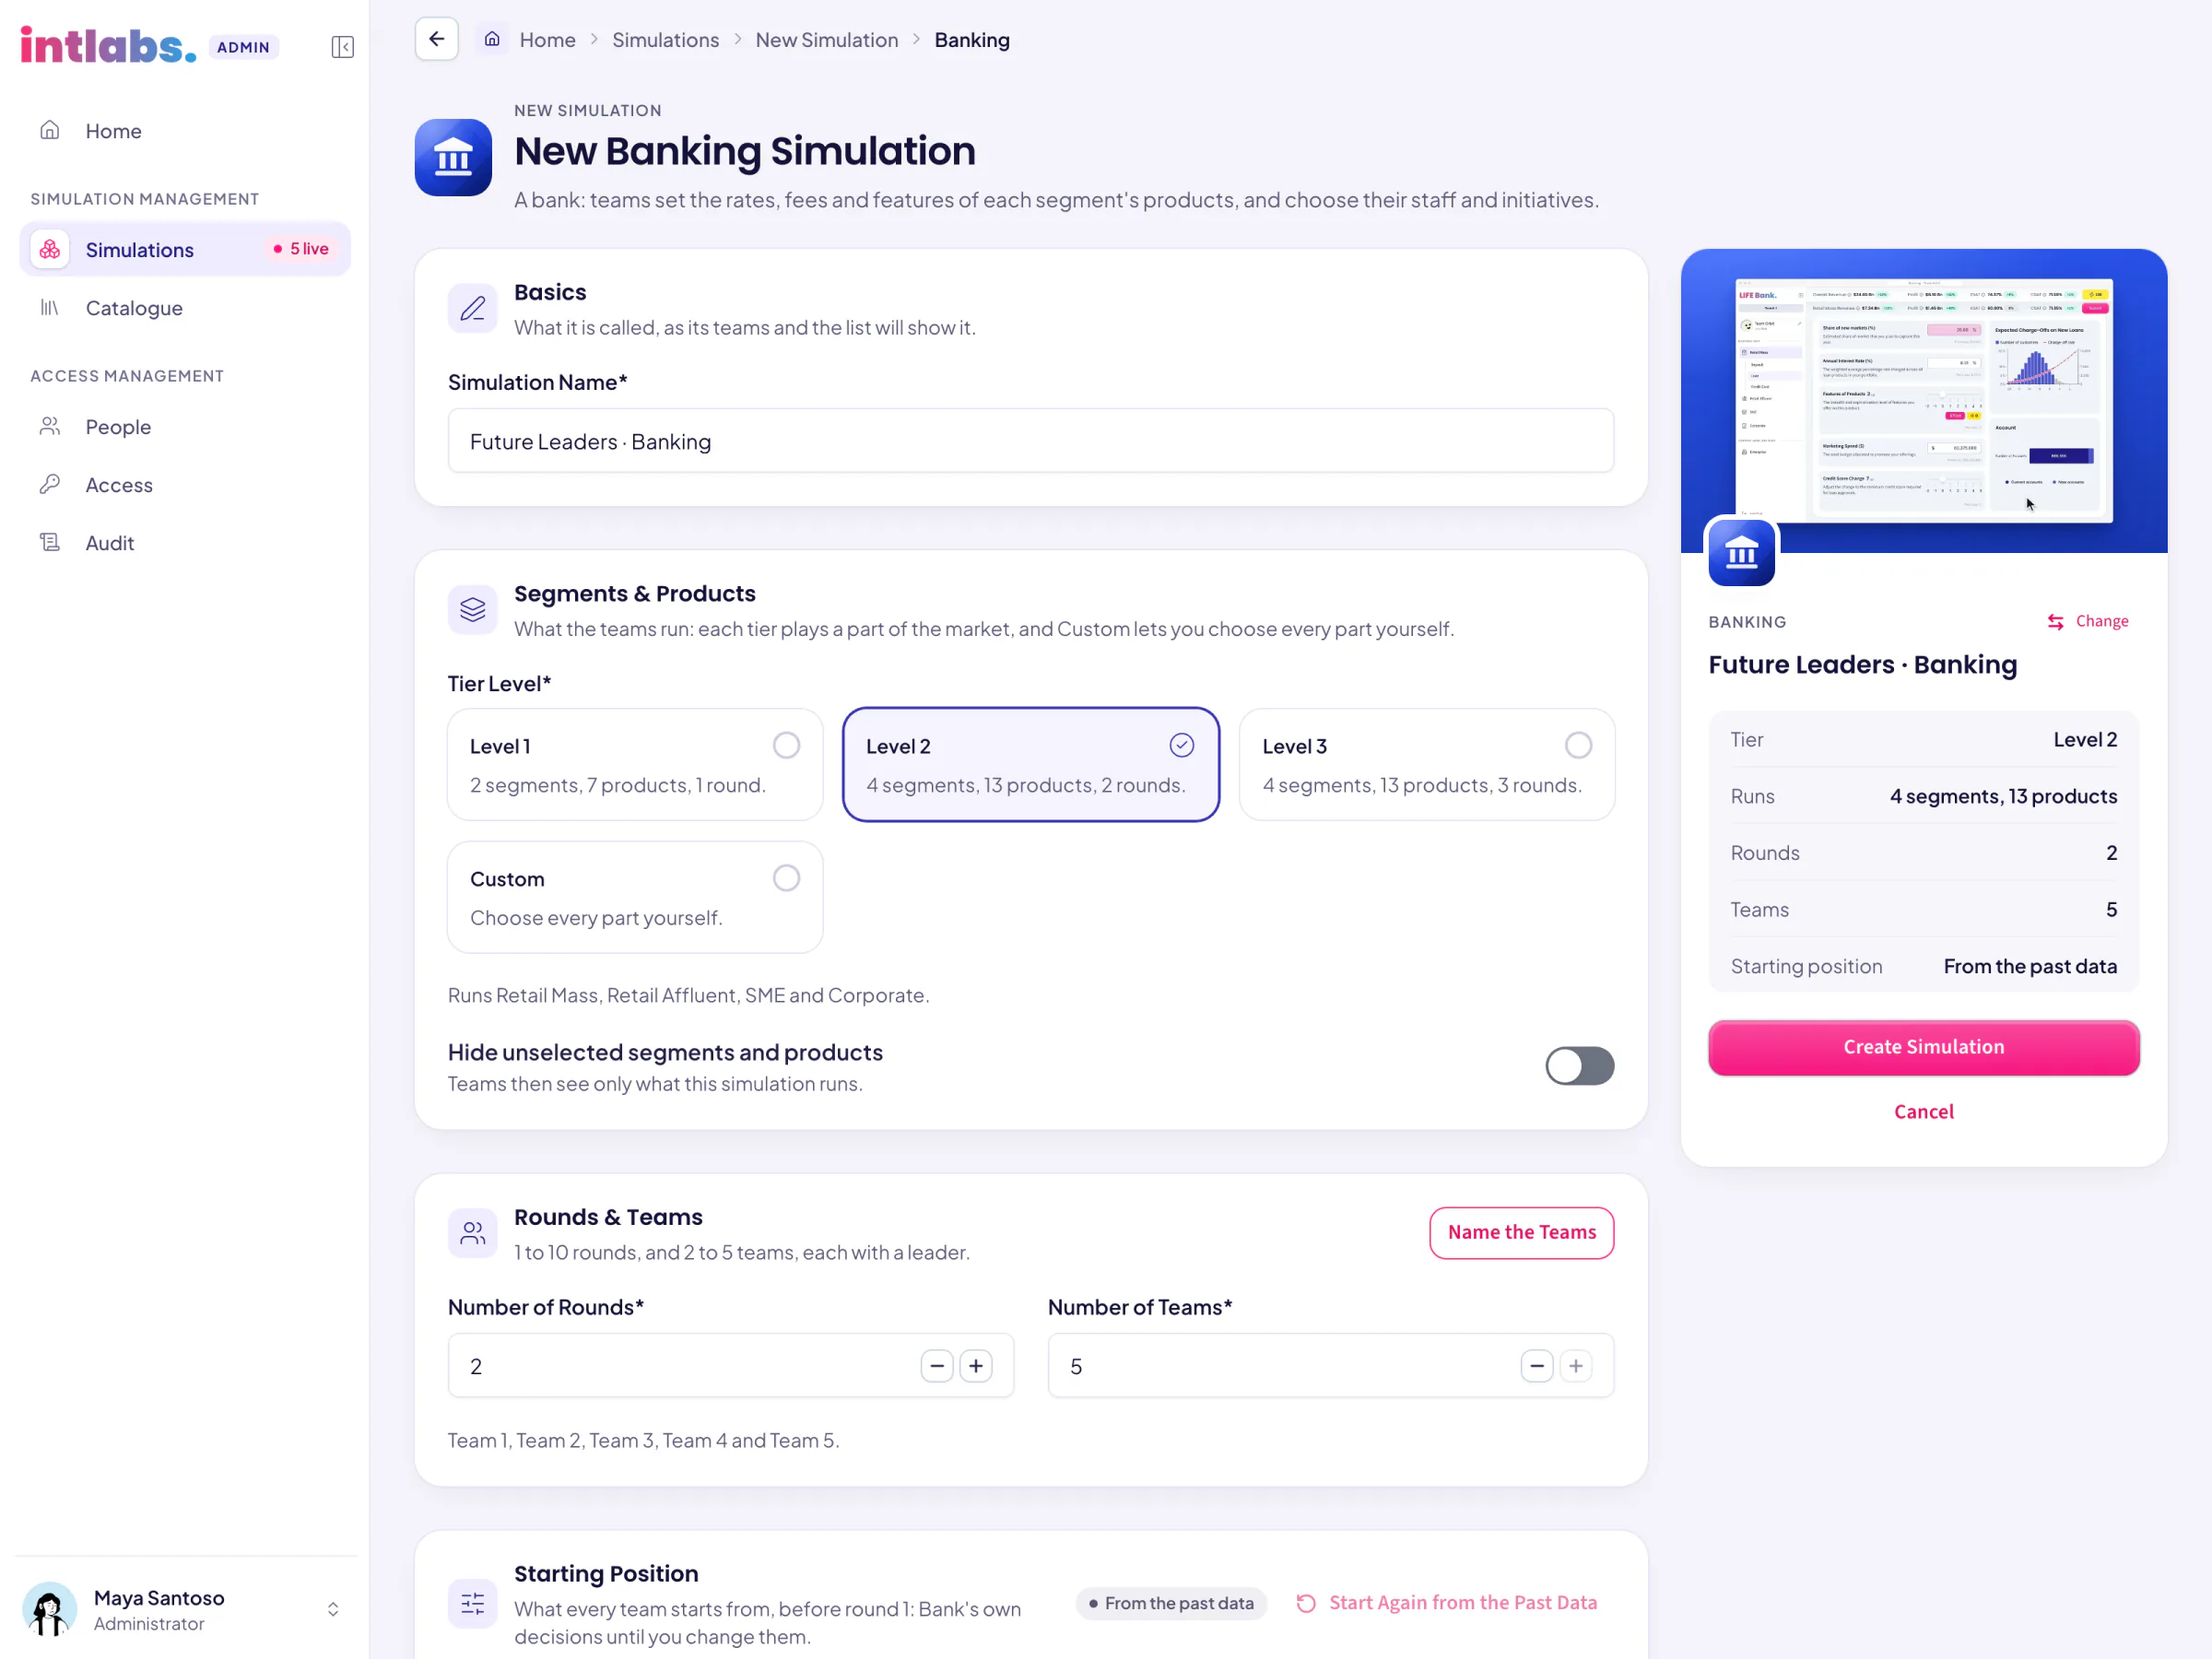
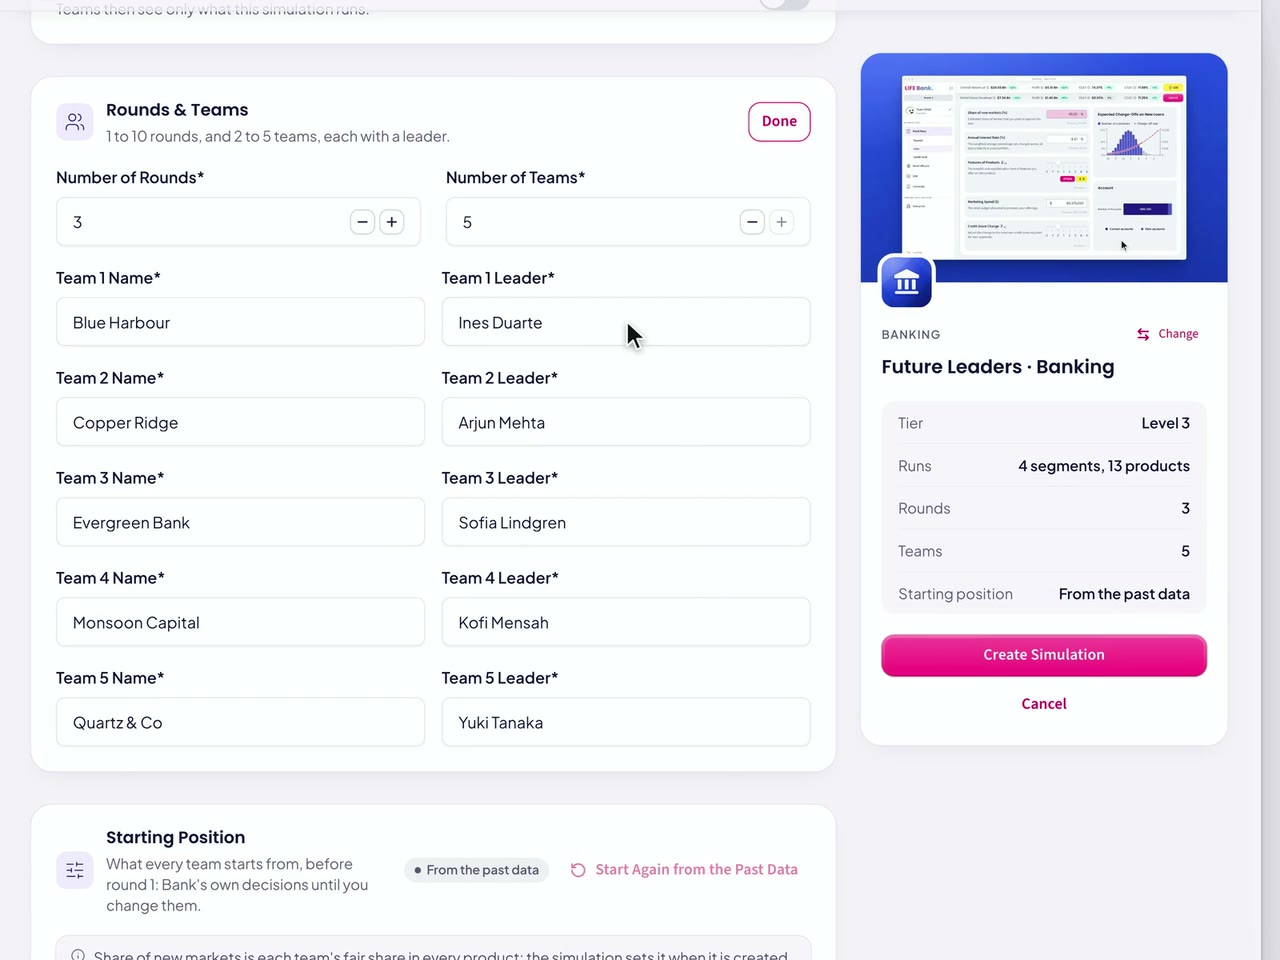
A one-page Banking set-up form: name, tier (Level 2 chosen), rounds and teams, with a summary card beside it.
10A simulation is set up on one page
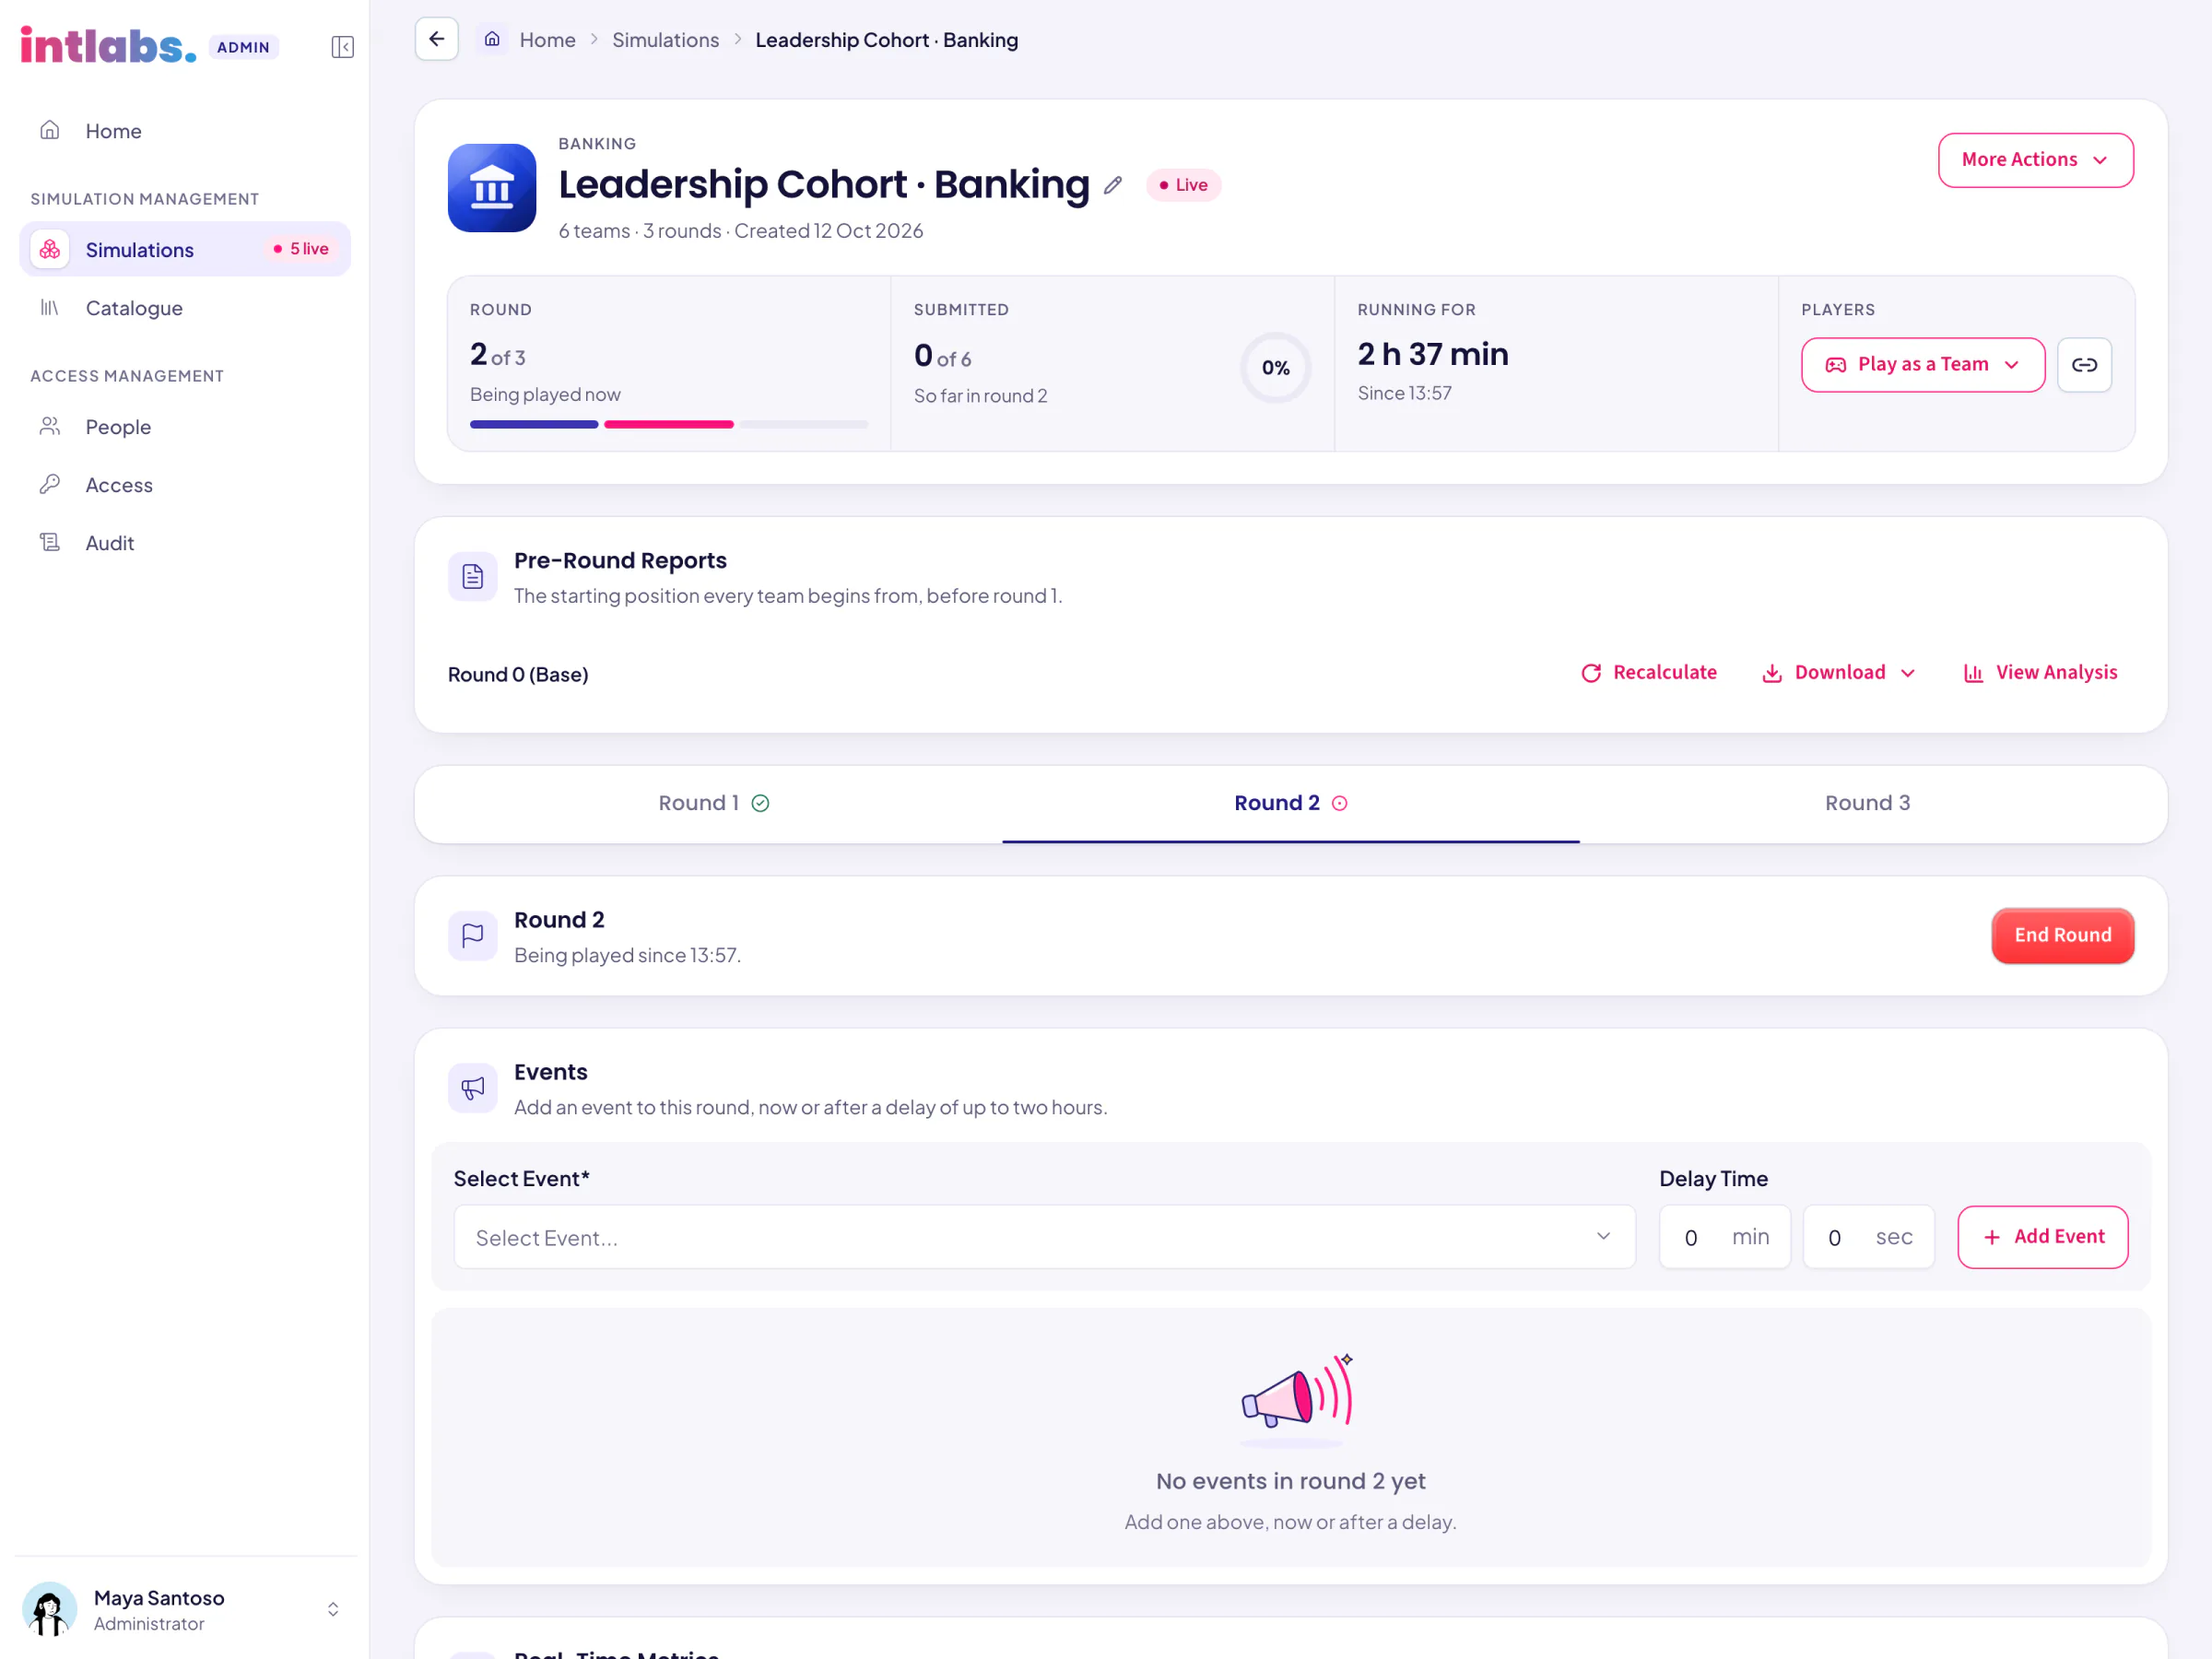
A simulation's page, live: round 2 of 3, 0 of 6 submitted, pre-round reports, round tabs, an End Round button and events.
11A round, live, from the simulation's own page
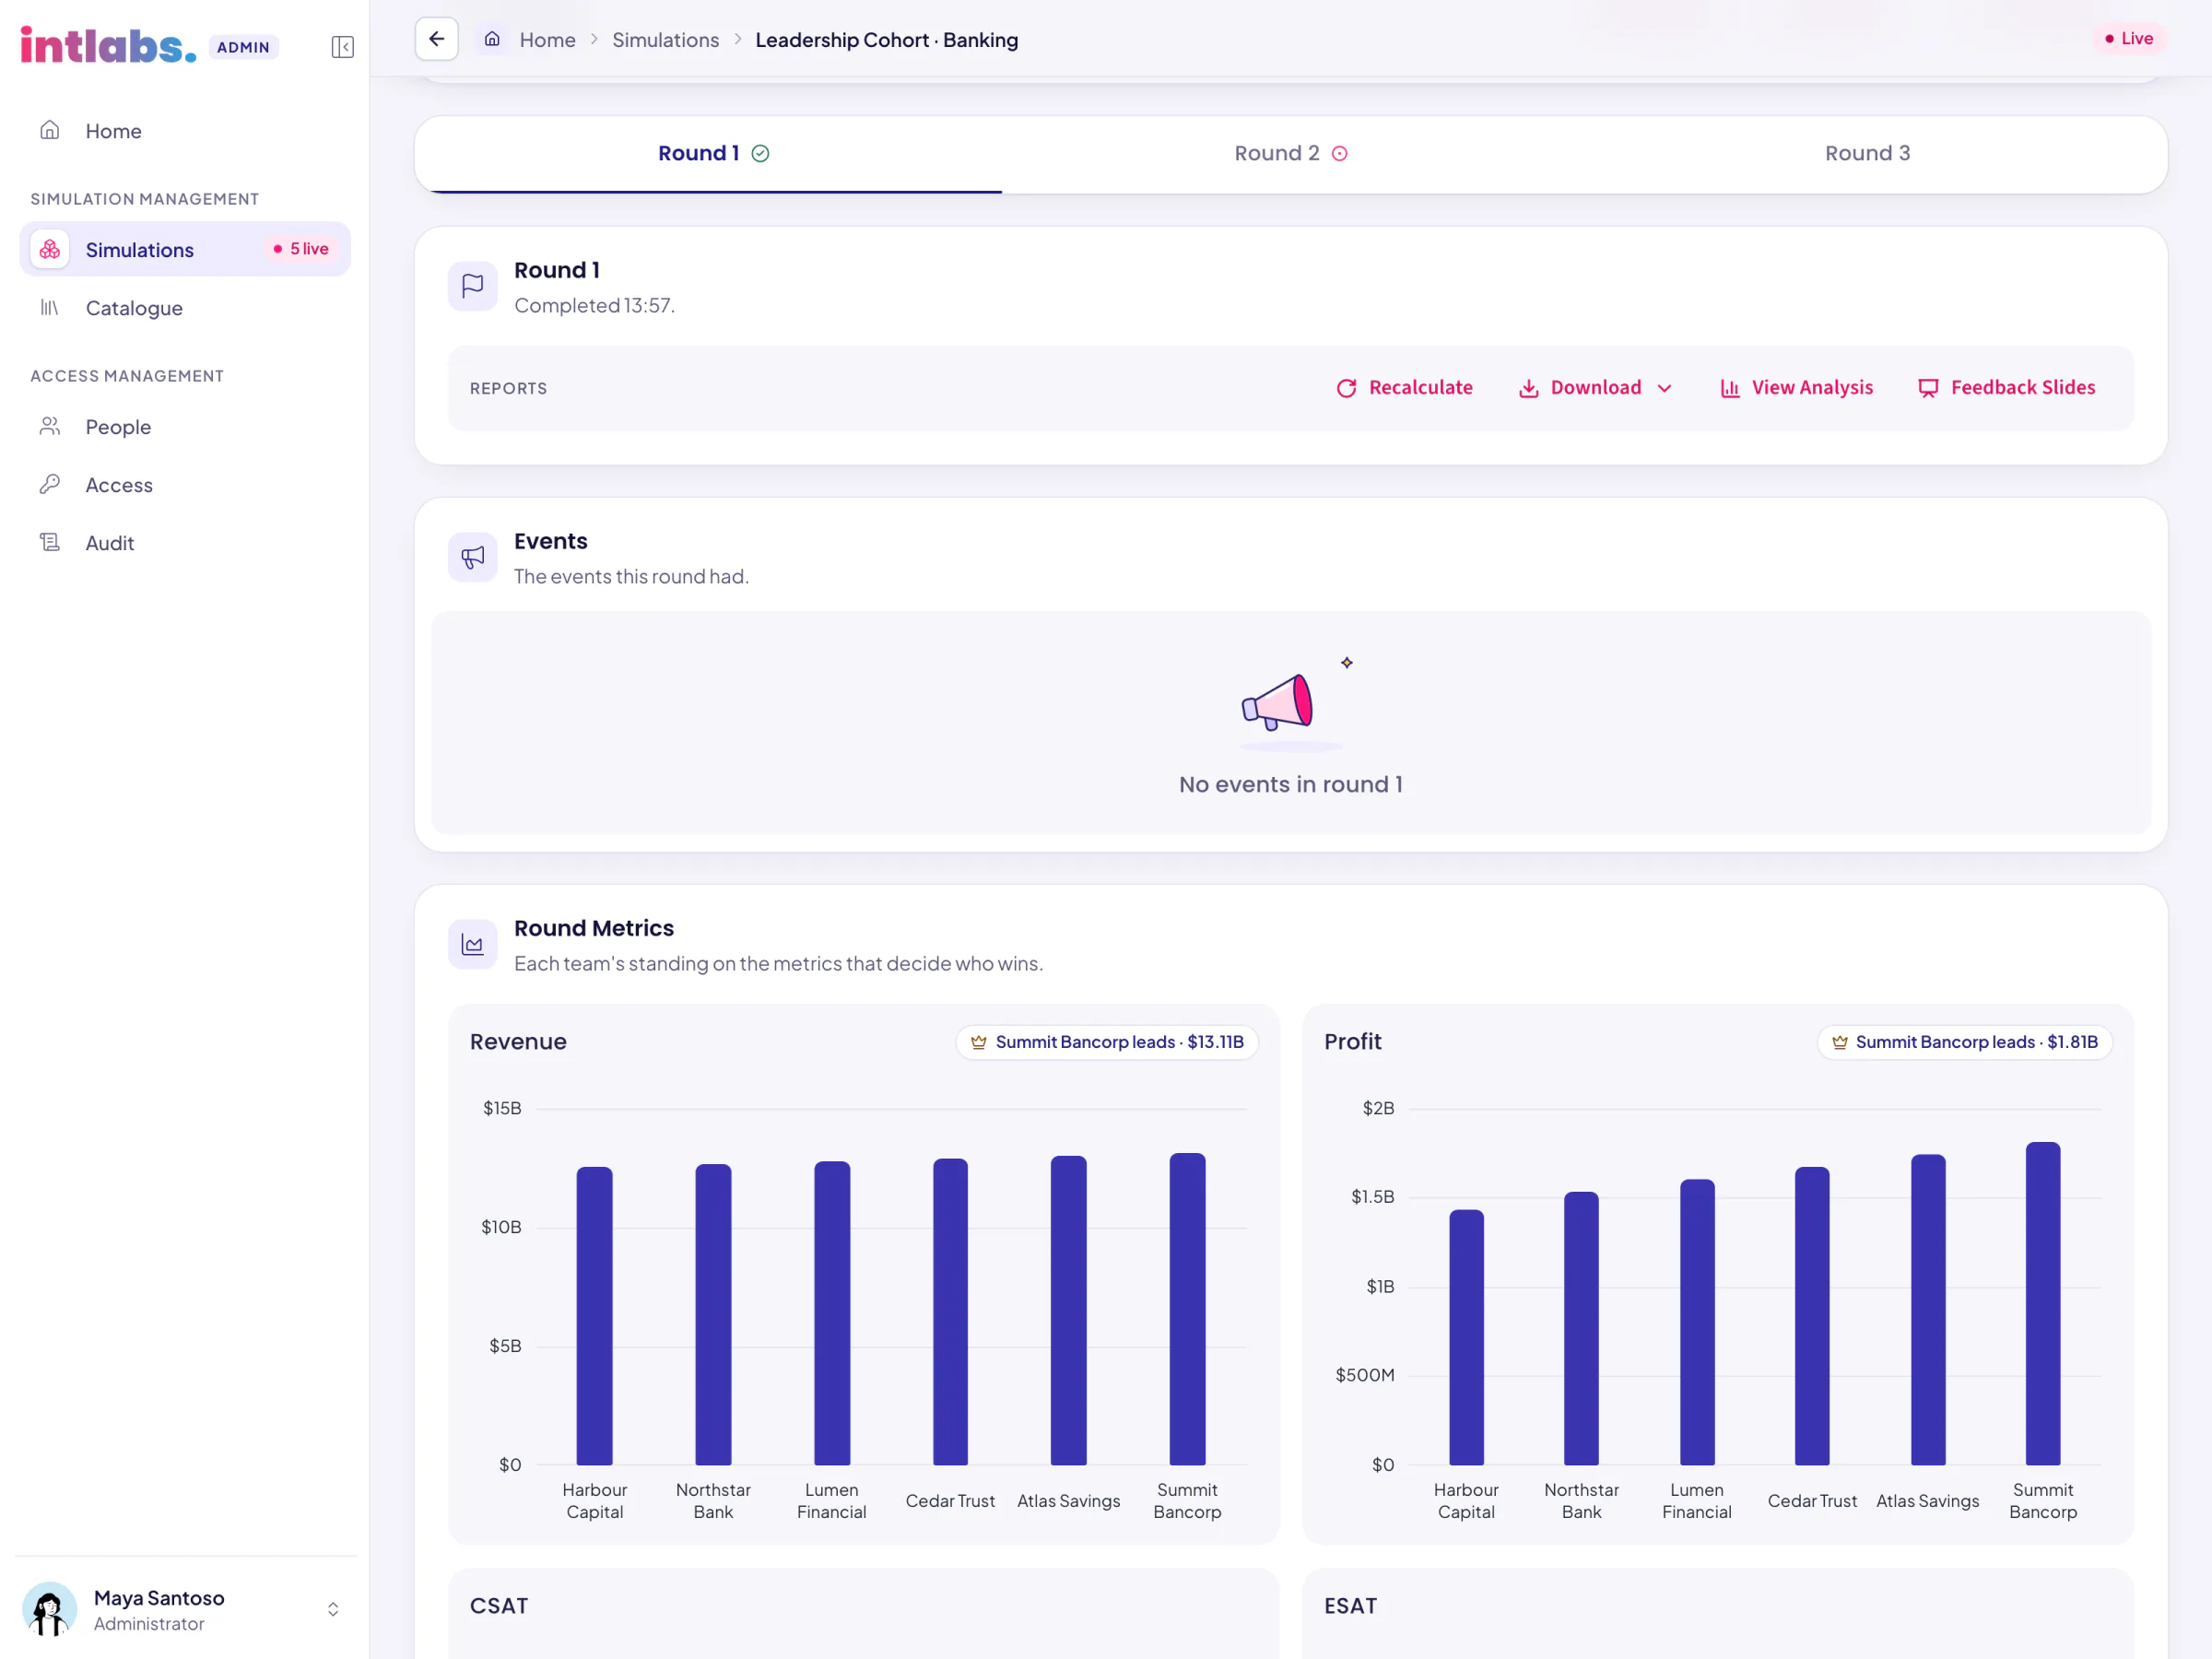
Round 1's tab: report actions, and bar charts of revenue and profit for six teams, with the leading team named.
12Results come as a chart per winning metric
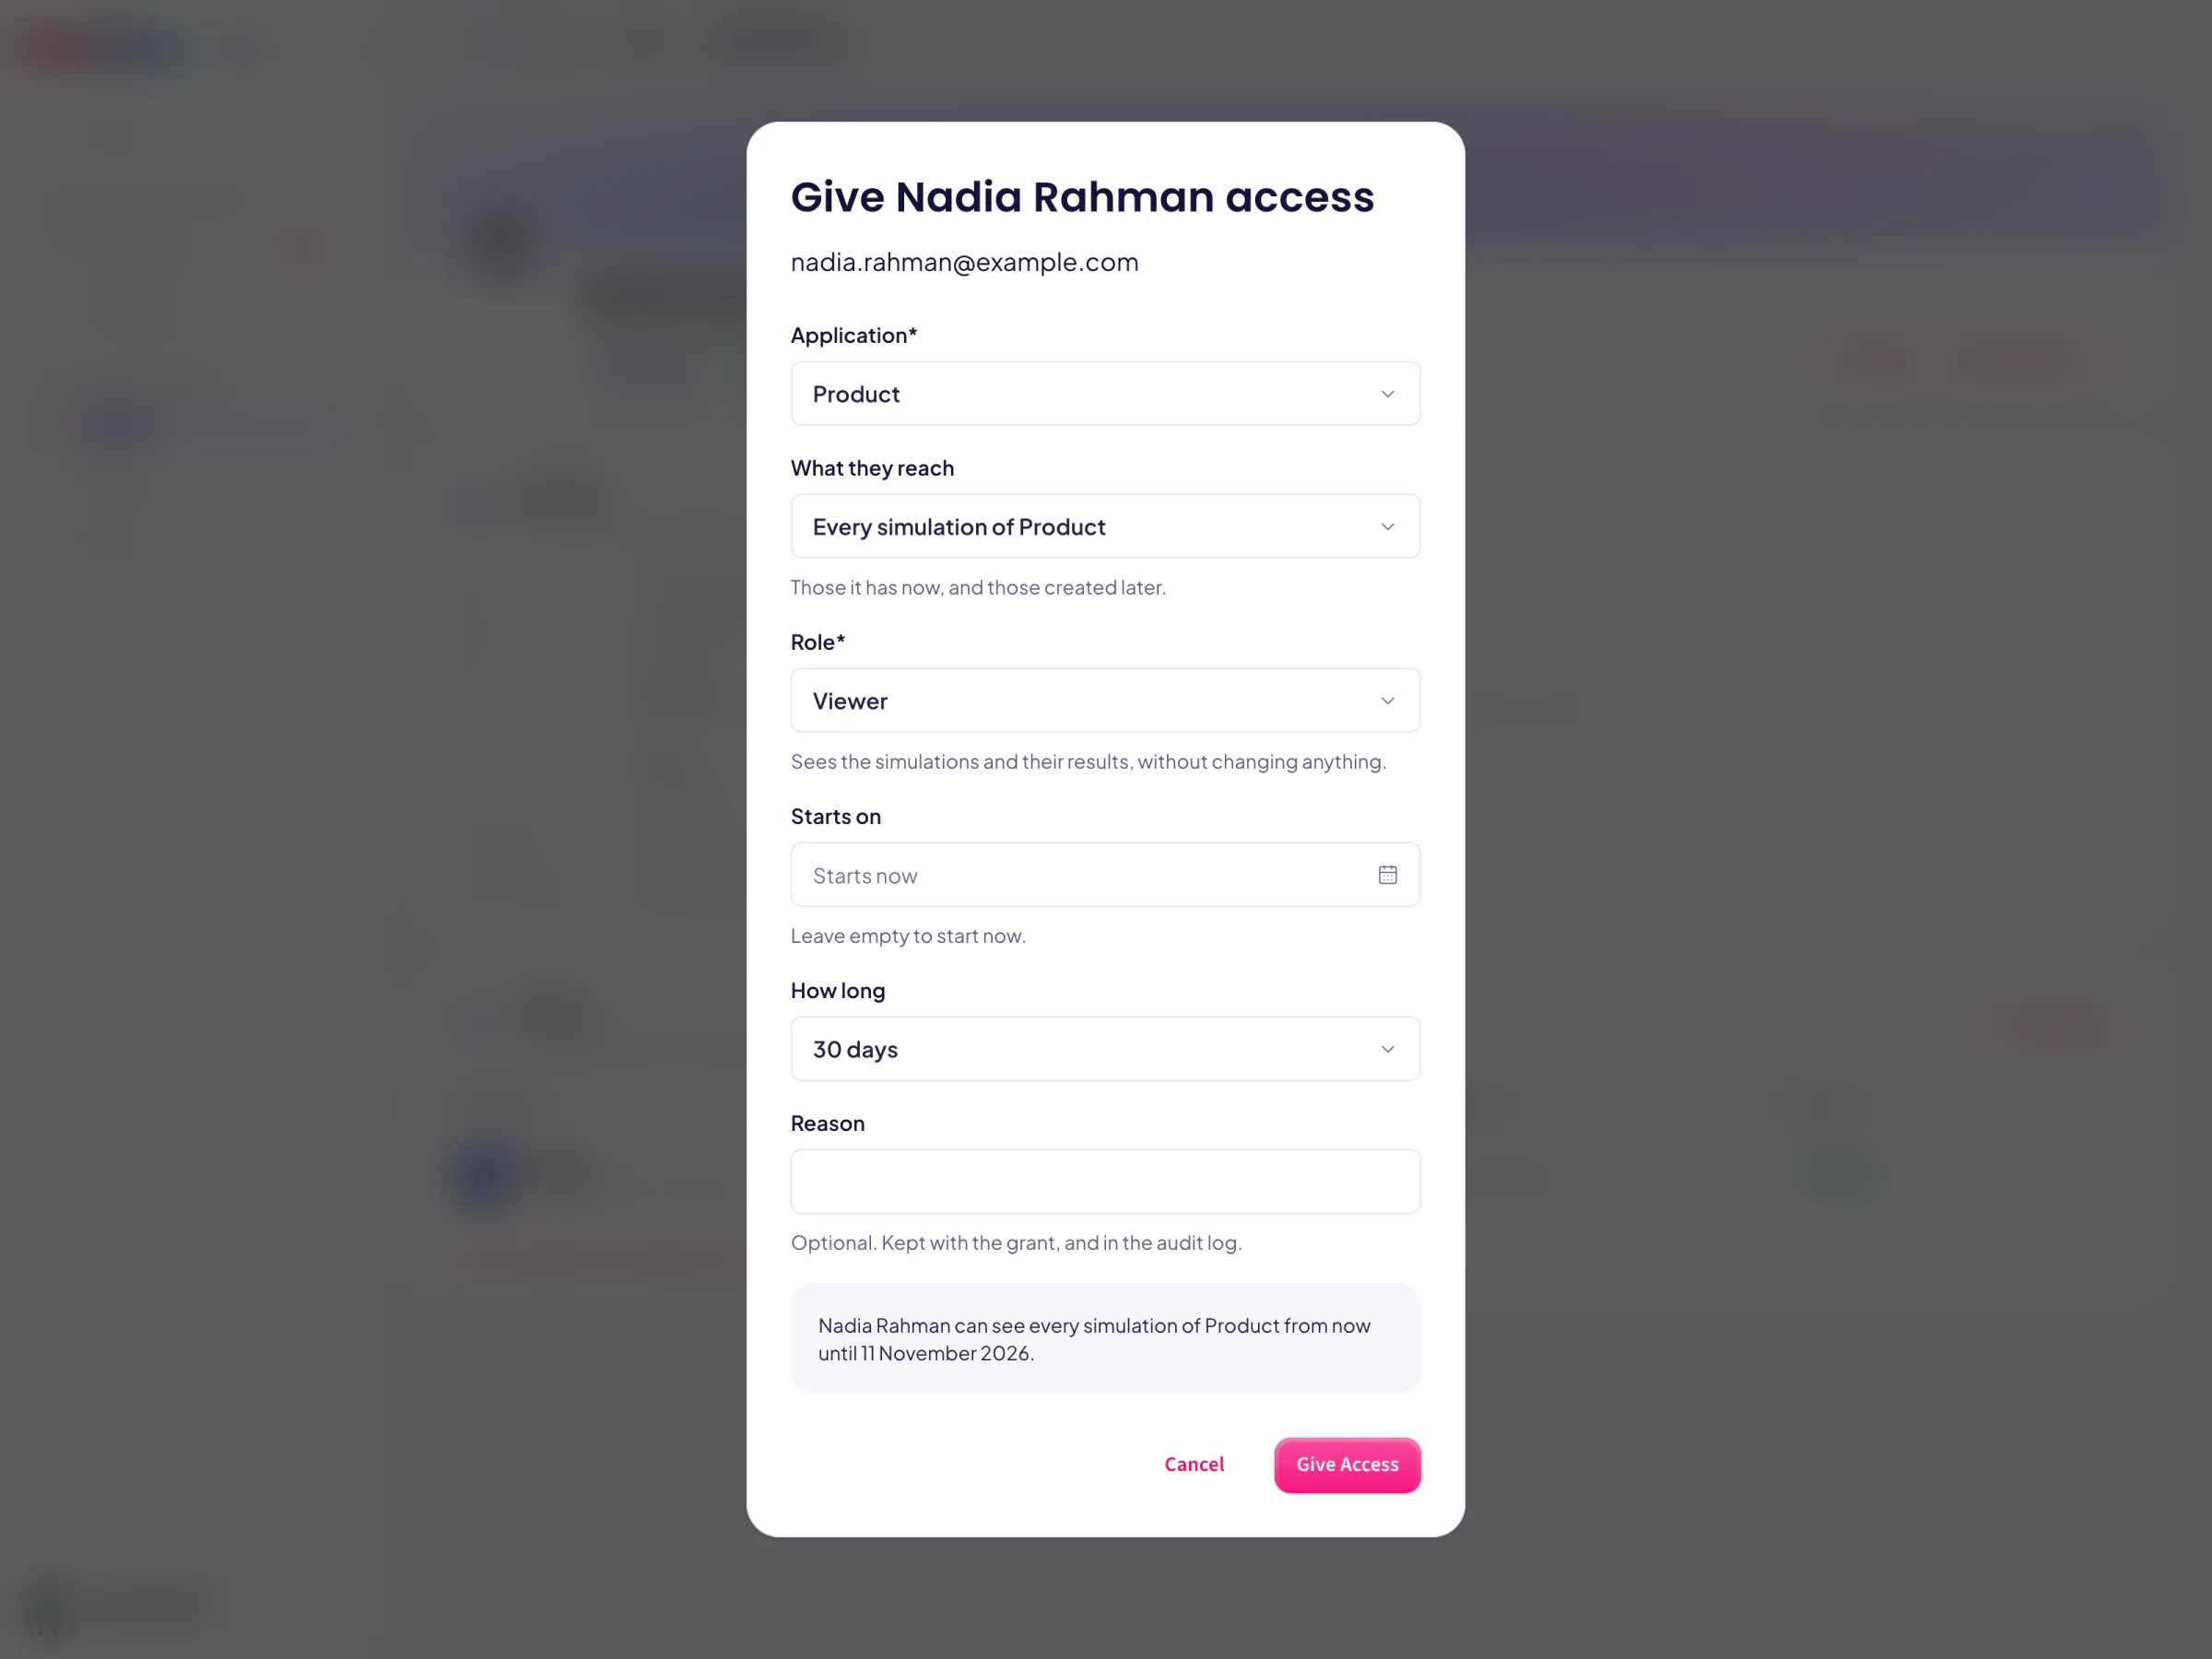
A Give access dialog: an application, every simulation, Viewer, 30 days, and a sentence saying access runs until 11 November 2026.
13Giving access, with a sentence that says what will happen
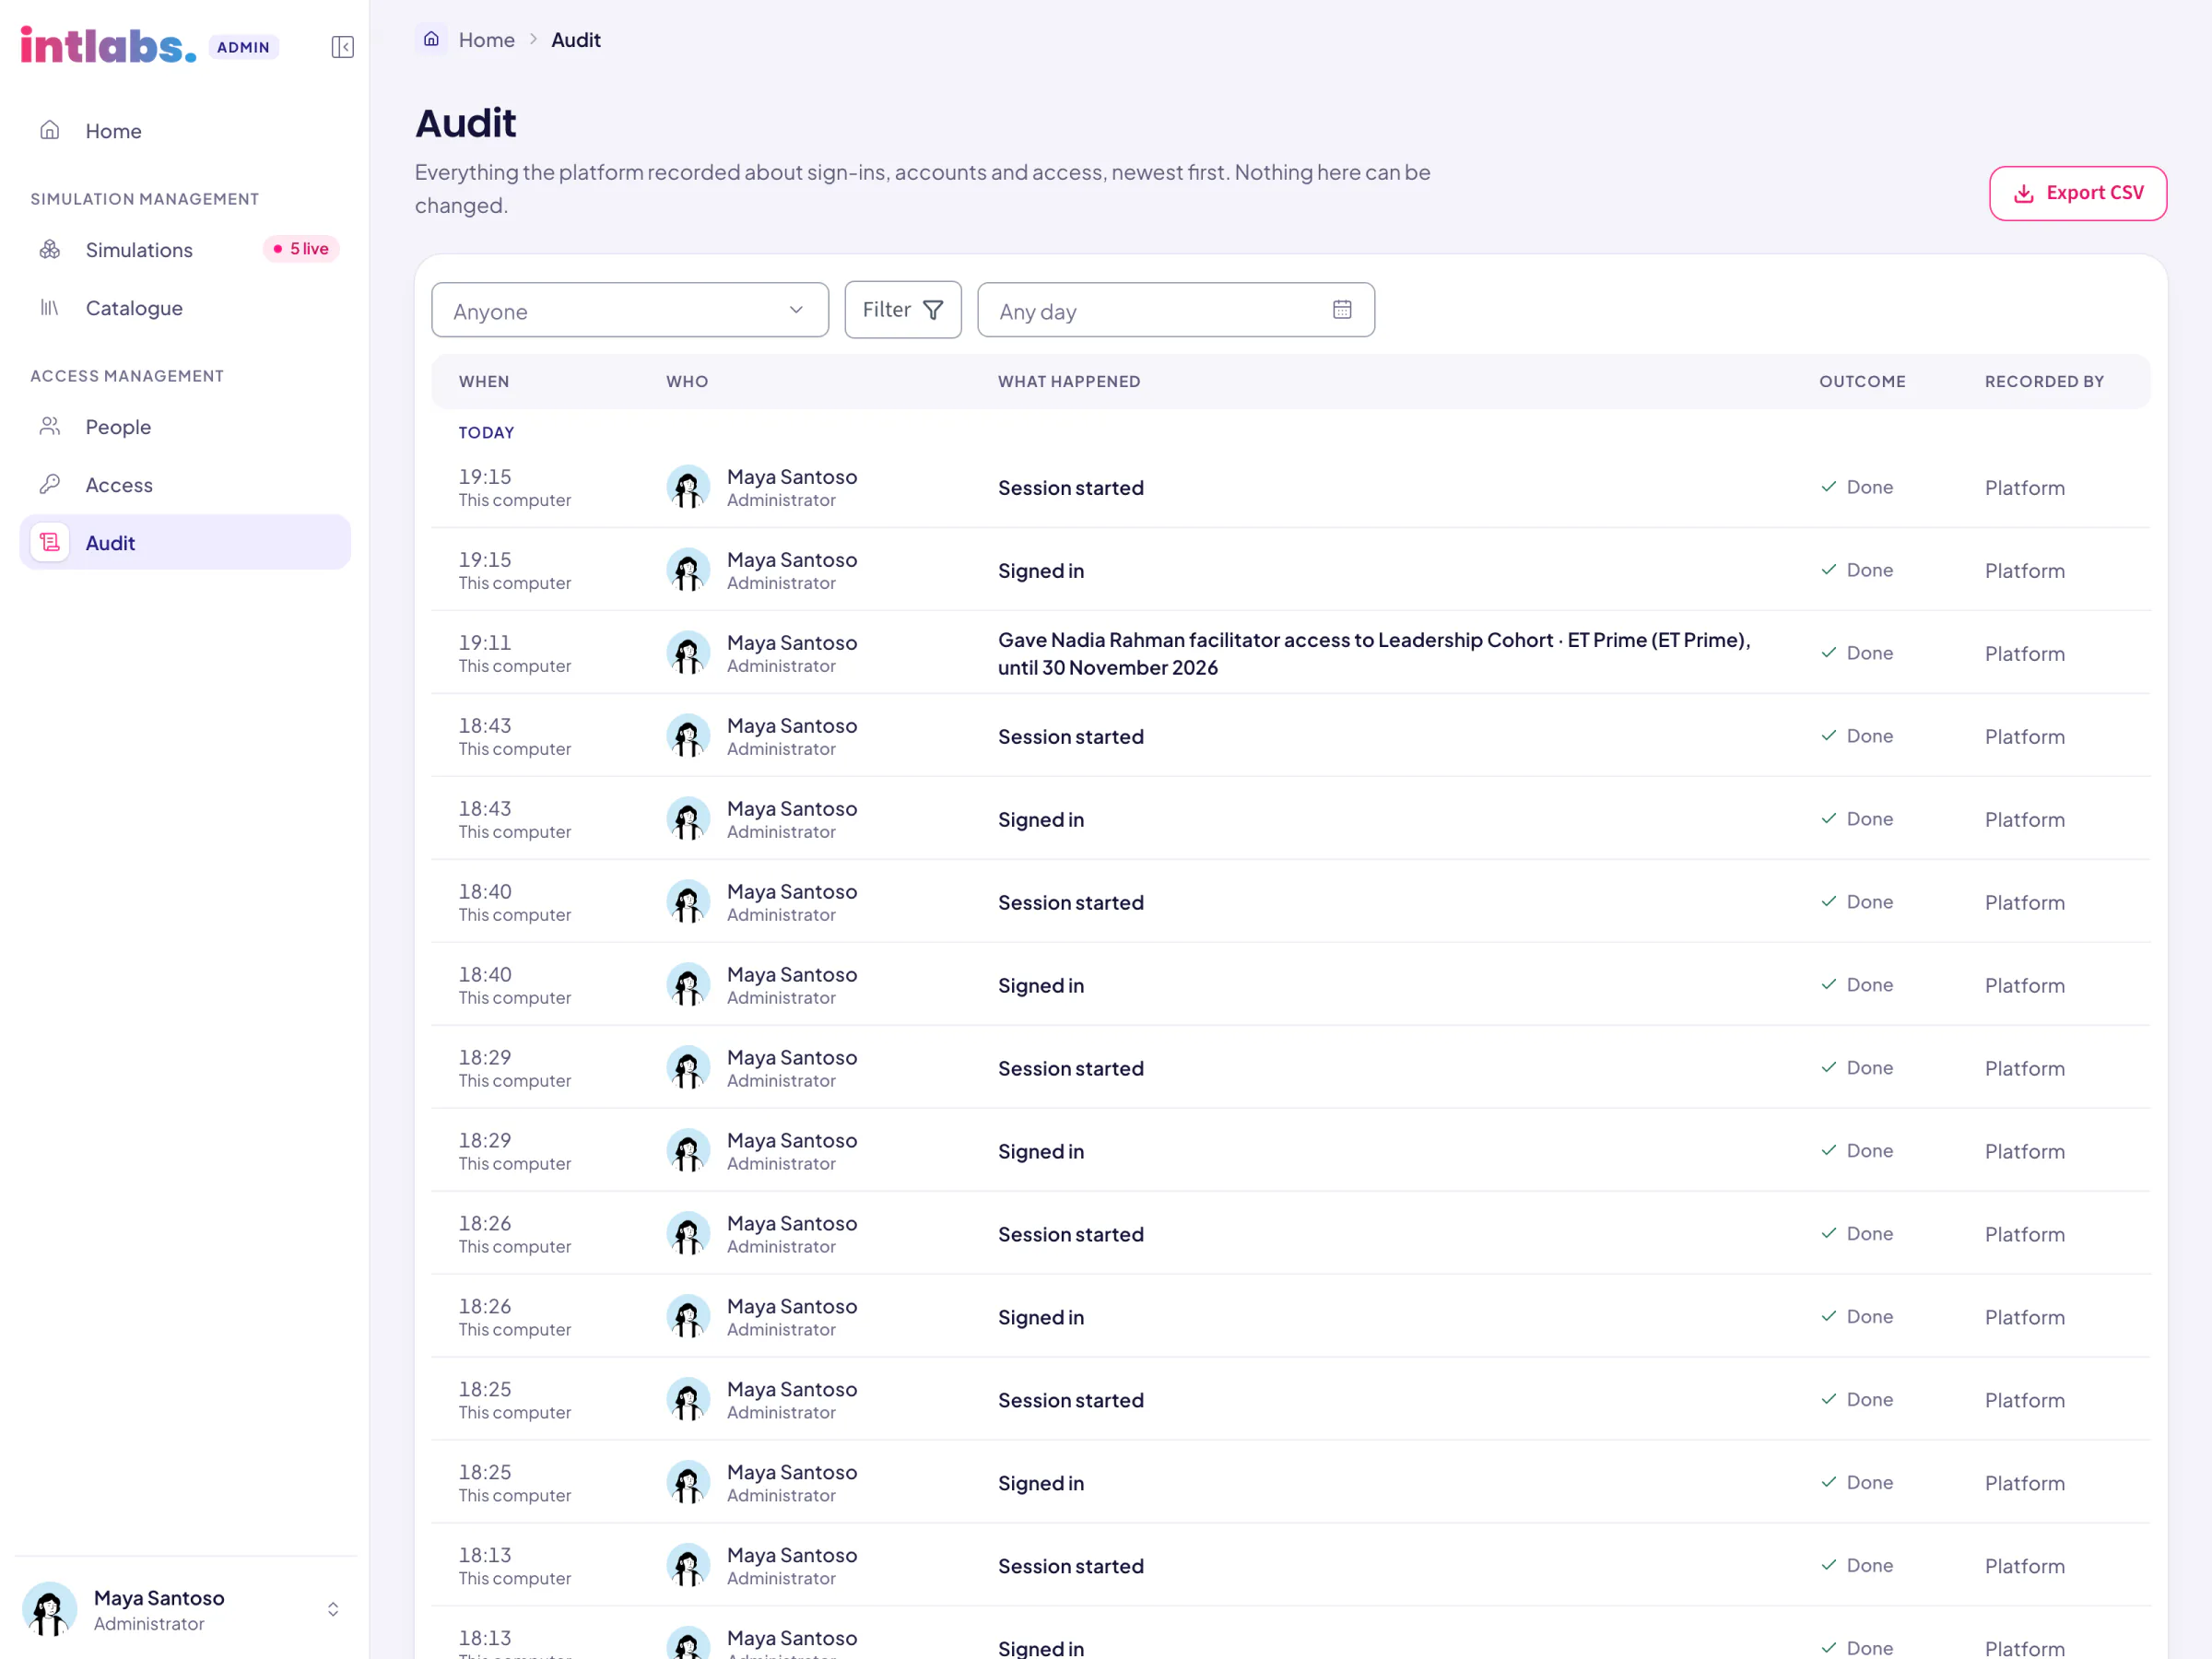
The audit log, newest first: who did what and when, with sign-ins, sessions and one grant written as a sentence.
14The audit log, written in words
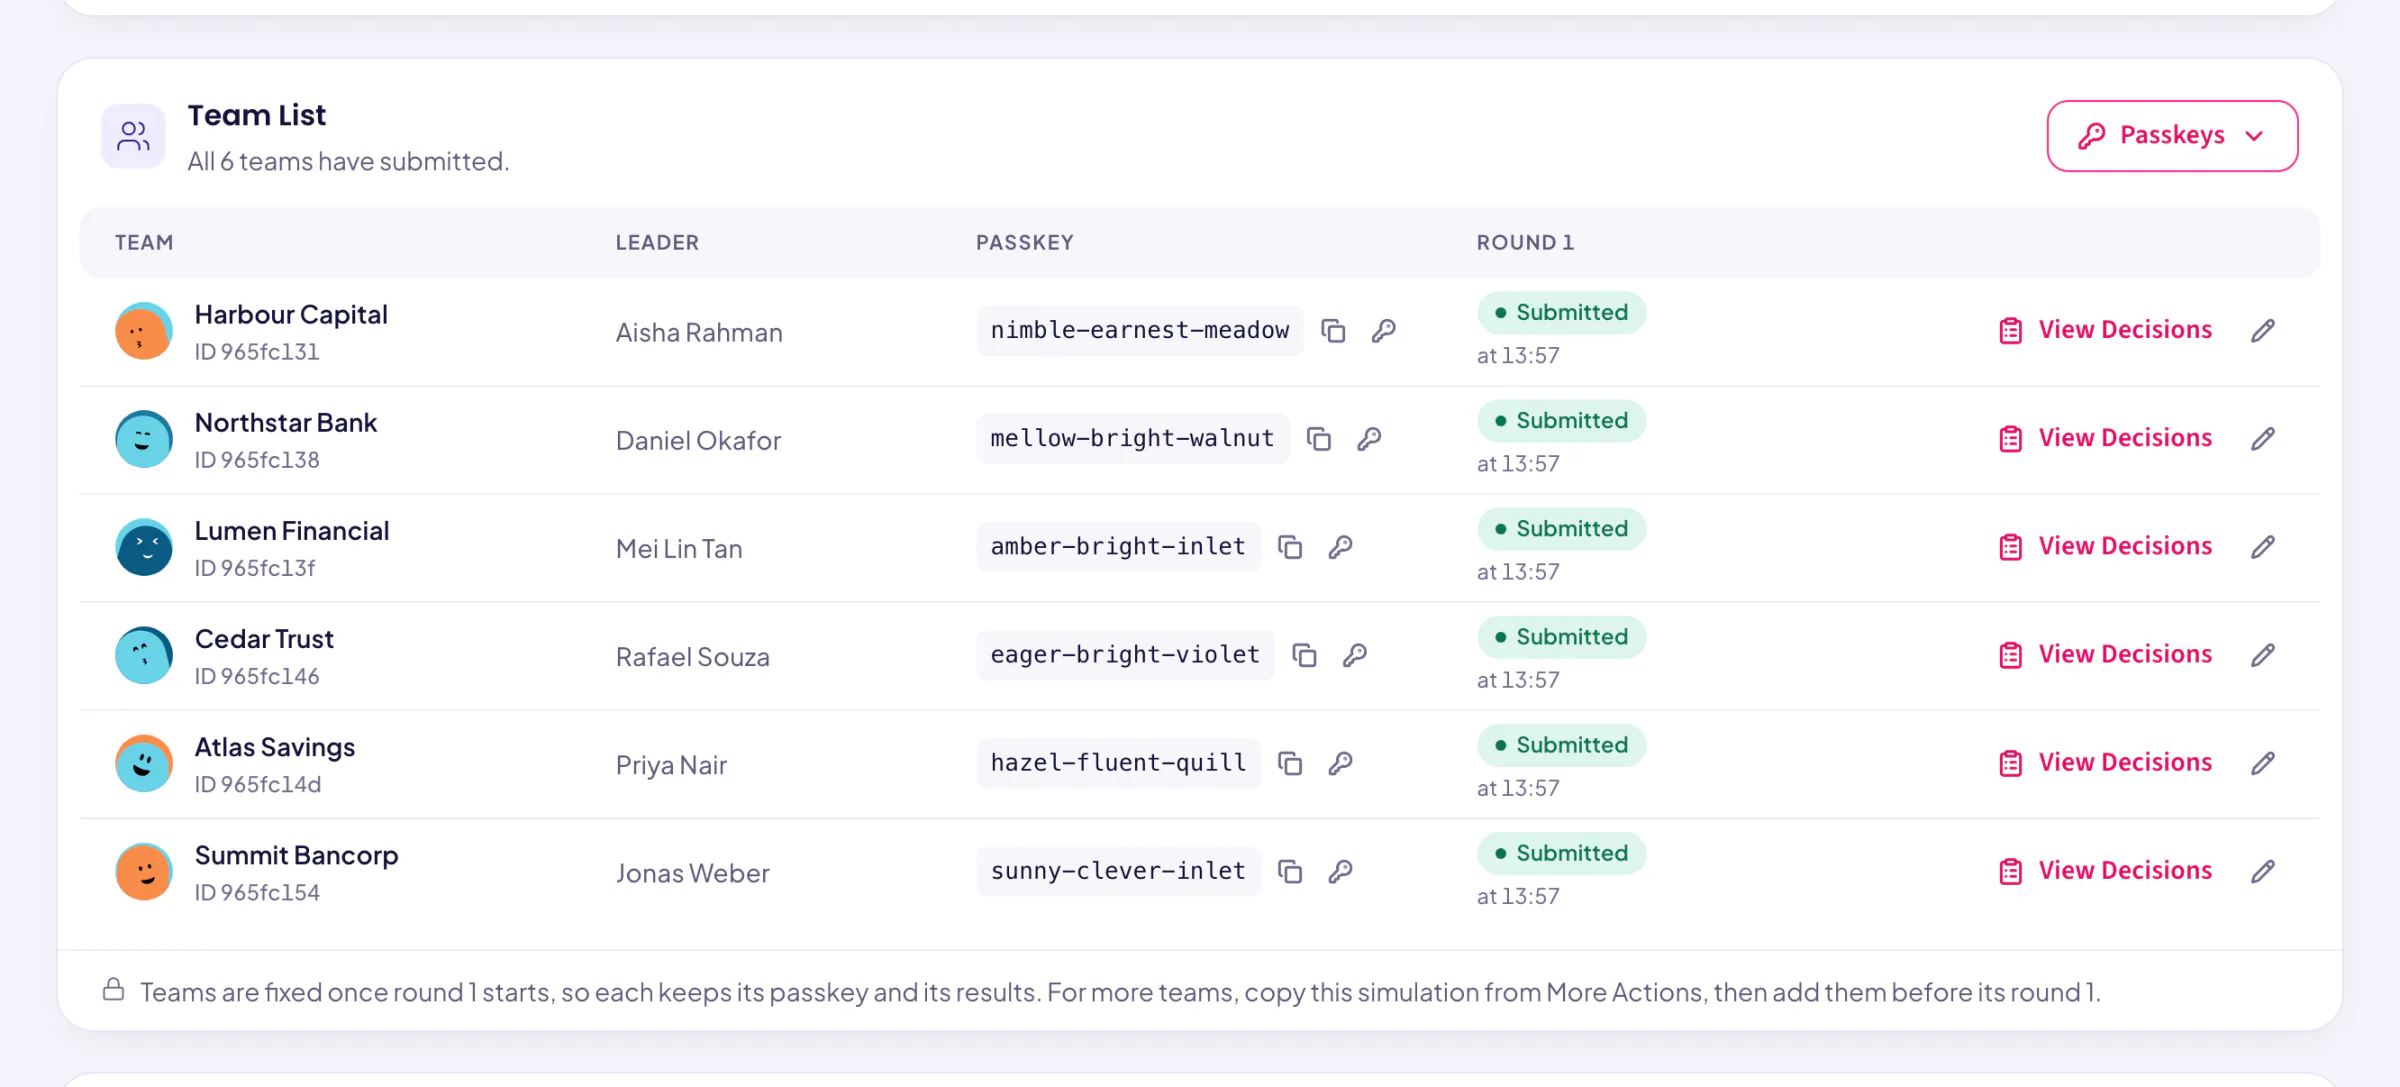
A team list: six teams with leaders, passkeys and a green "Submitted" badge each, and a Passkeys menu button.
15A team list, with every passkey to hand out
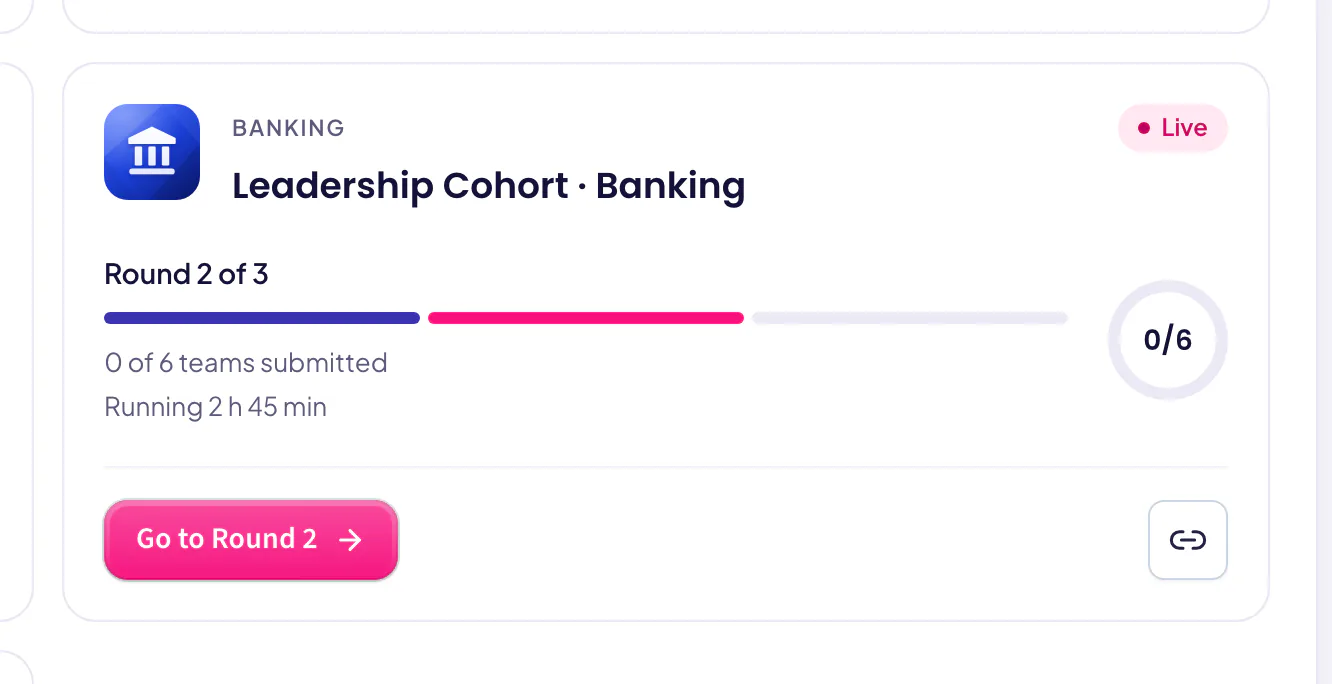
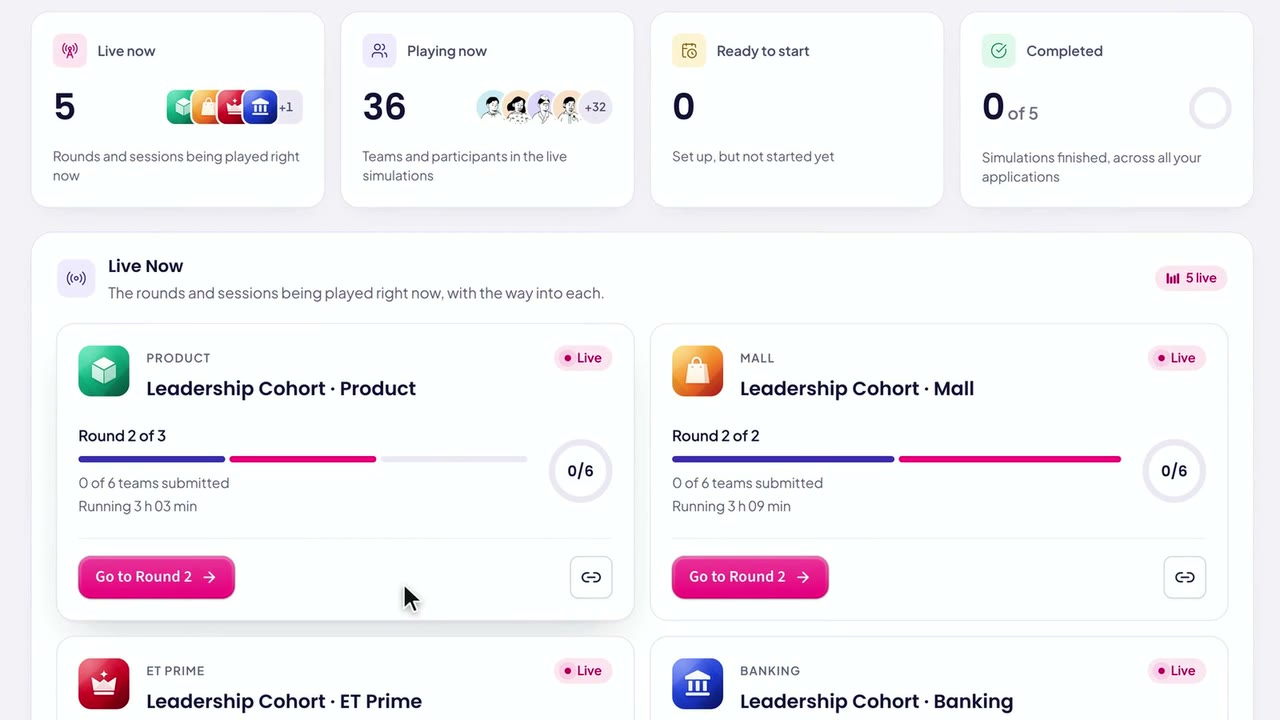
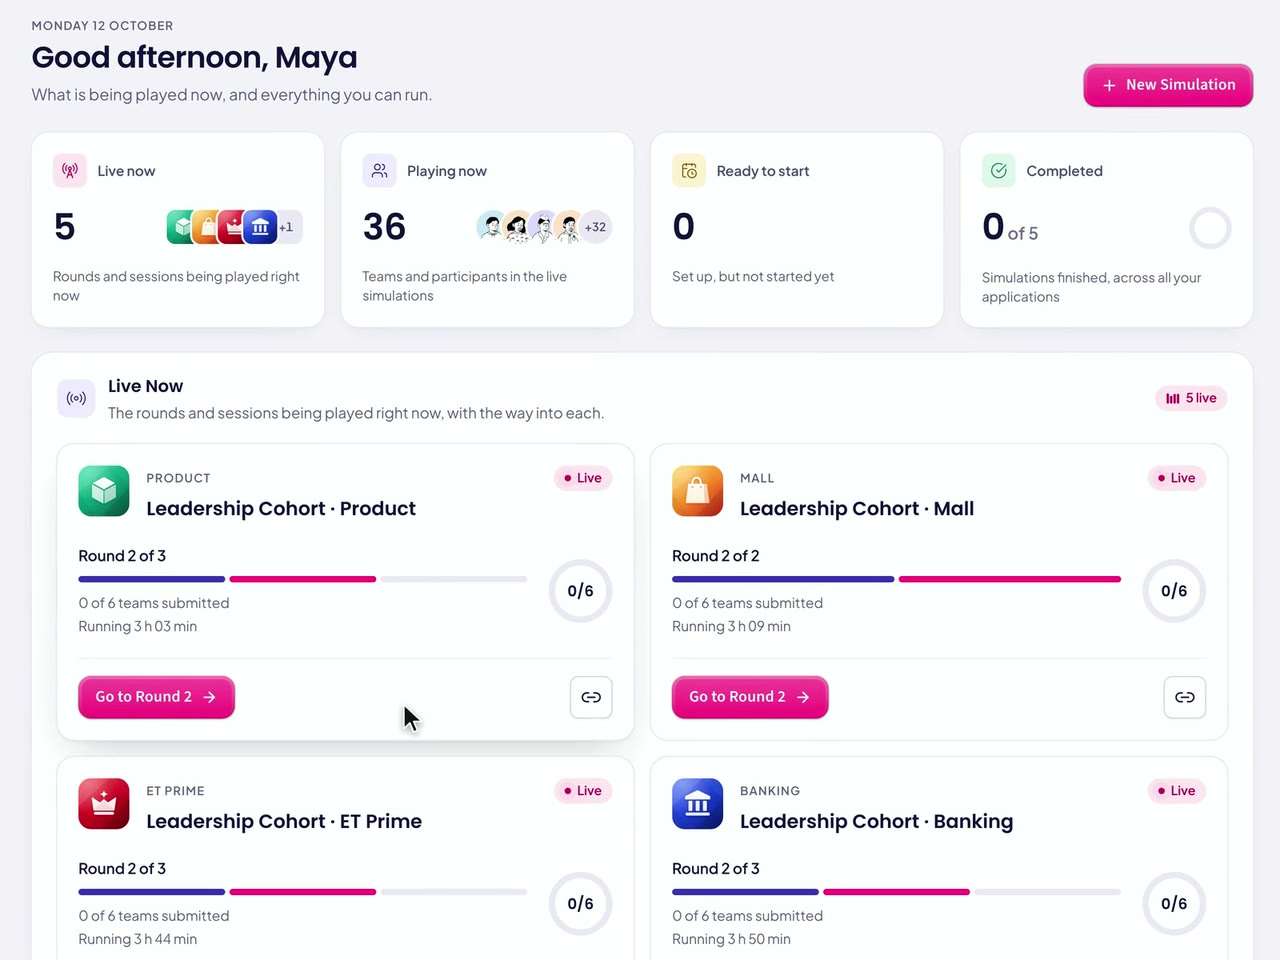
One Live Now card: a cohort's name, round 2 of 3, 0 of 6 teams submitted, a ring, and Go to Round 2.
16One Live Now card
17 · VideoSetting up a simulation, from Home to Start Round
03

Banking: Run a Full-Service Bank

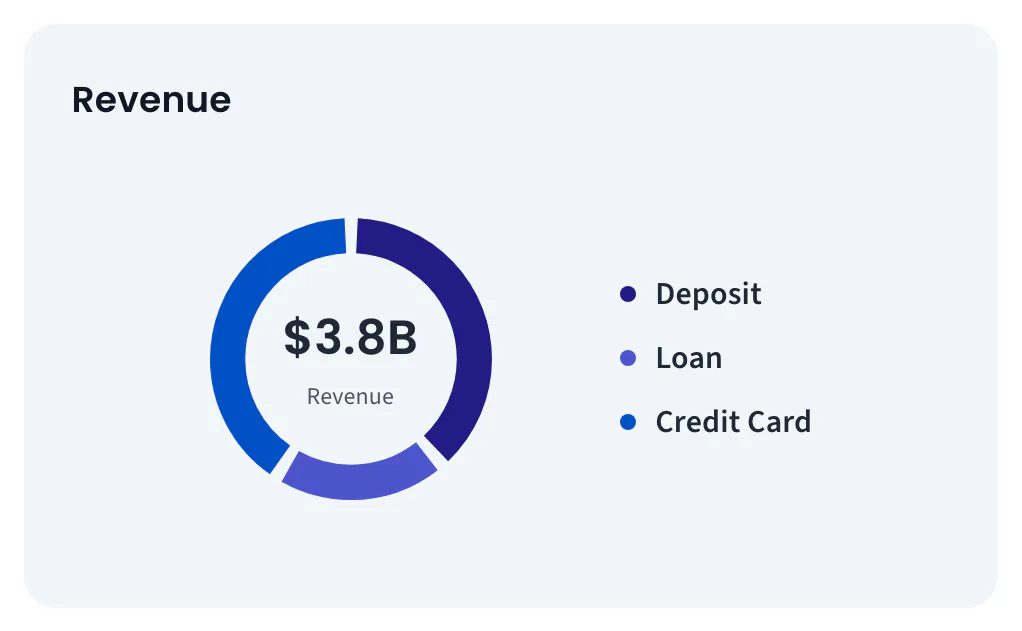
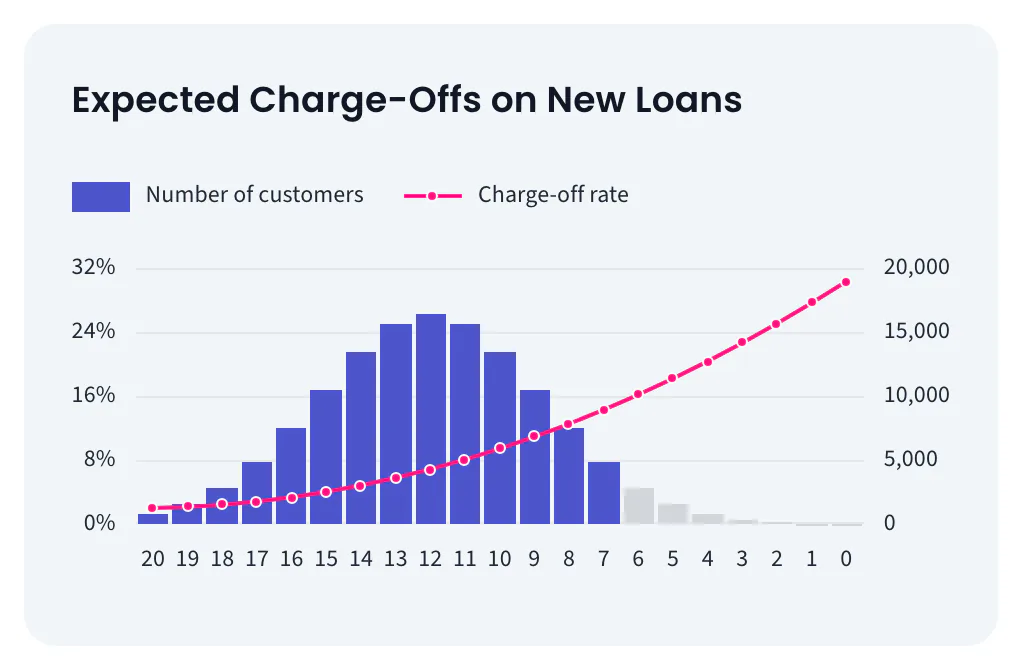
Each team runs its own copy of LIFE Bank, a fictional bank with four business units and thirteen products, in one shared market. A round is a fiscal year and holds 79 settings, plus up to 3 of 16 initiatives. Every change saves by itself and recomputes a live projection. Charts sit beside the decisions: a Revenue donut, an Account bar and expected charge-offs on loans. The engine places each team's value on a curve built from all the teams' values, and scores by rank on revenue, risk-adjusted profit and two satisfaction scores. Banking is the first player moved to the design system.

  • 13 products, 79 settings a round, 16 initiatives.
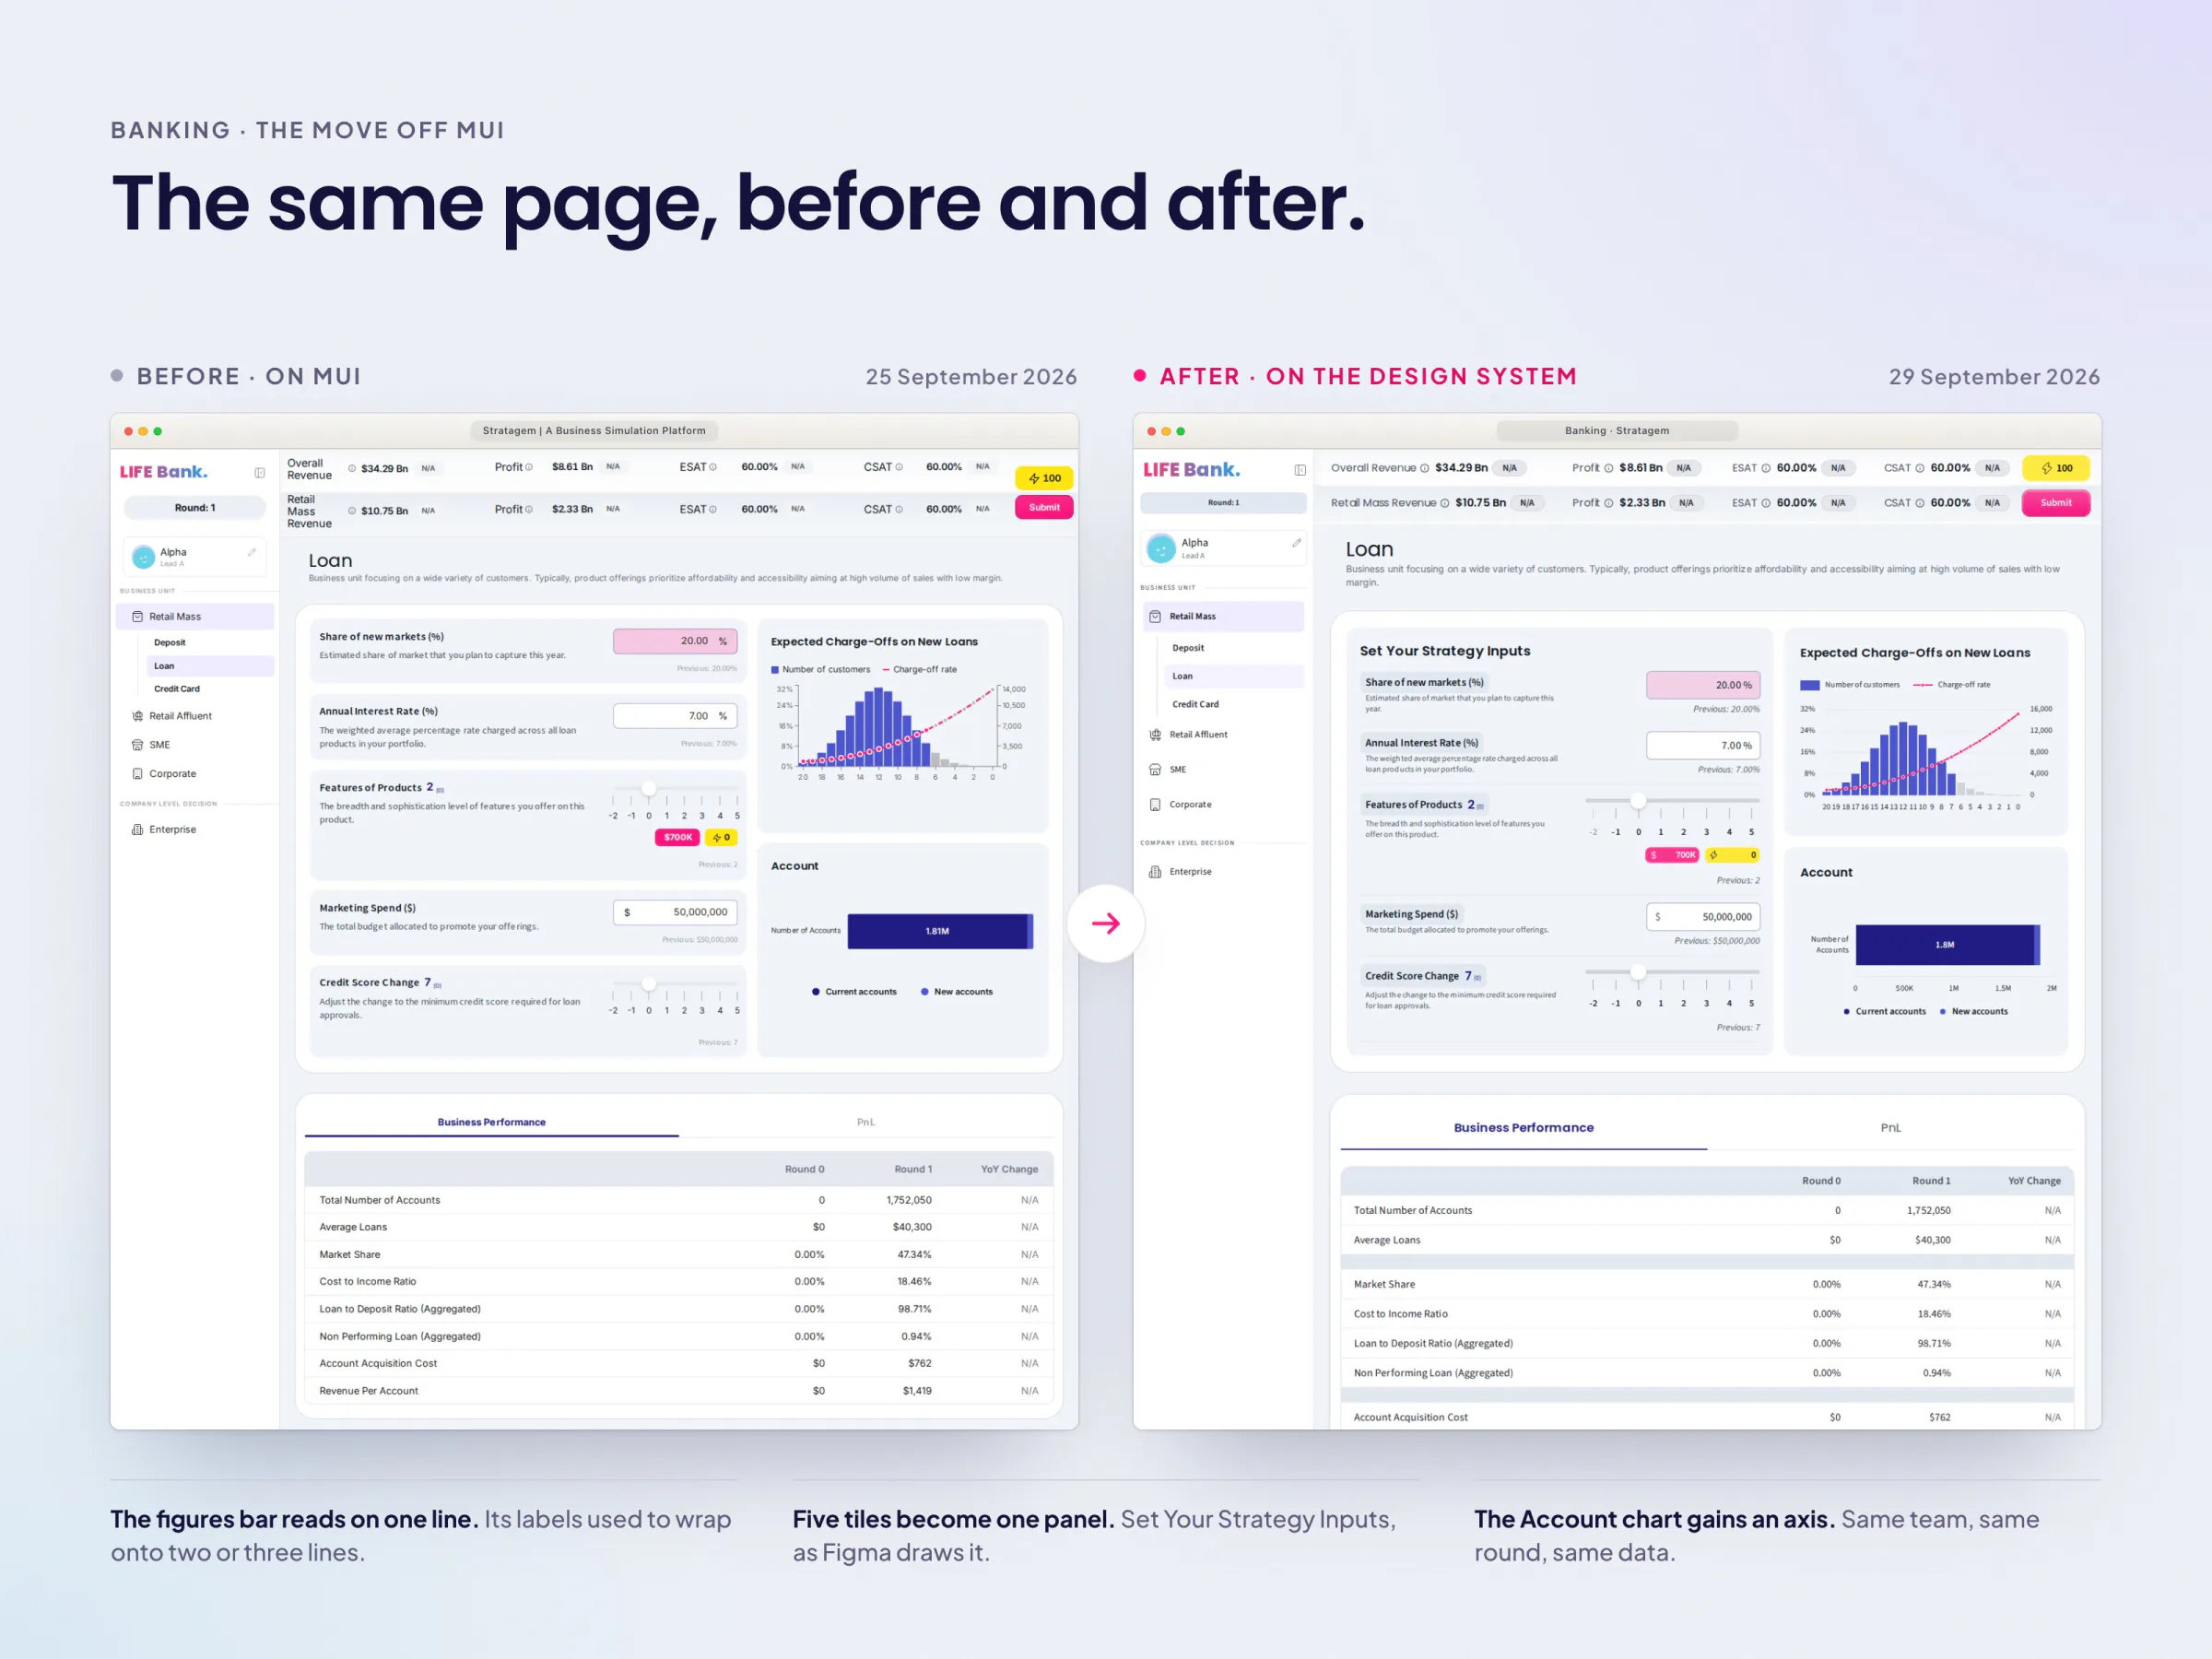
  • The frame, decisions, charts, statements and round flow are on the design system; some pages are still MUI.
  • 405 player unit tests, and a 57-check play-through with none failed.
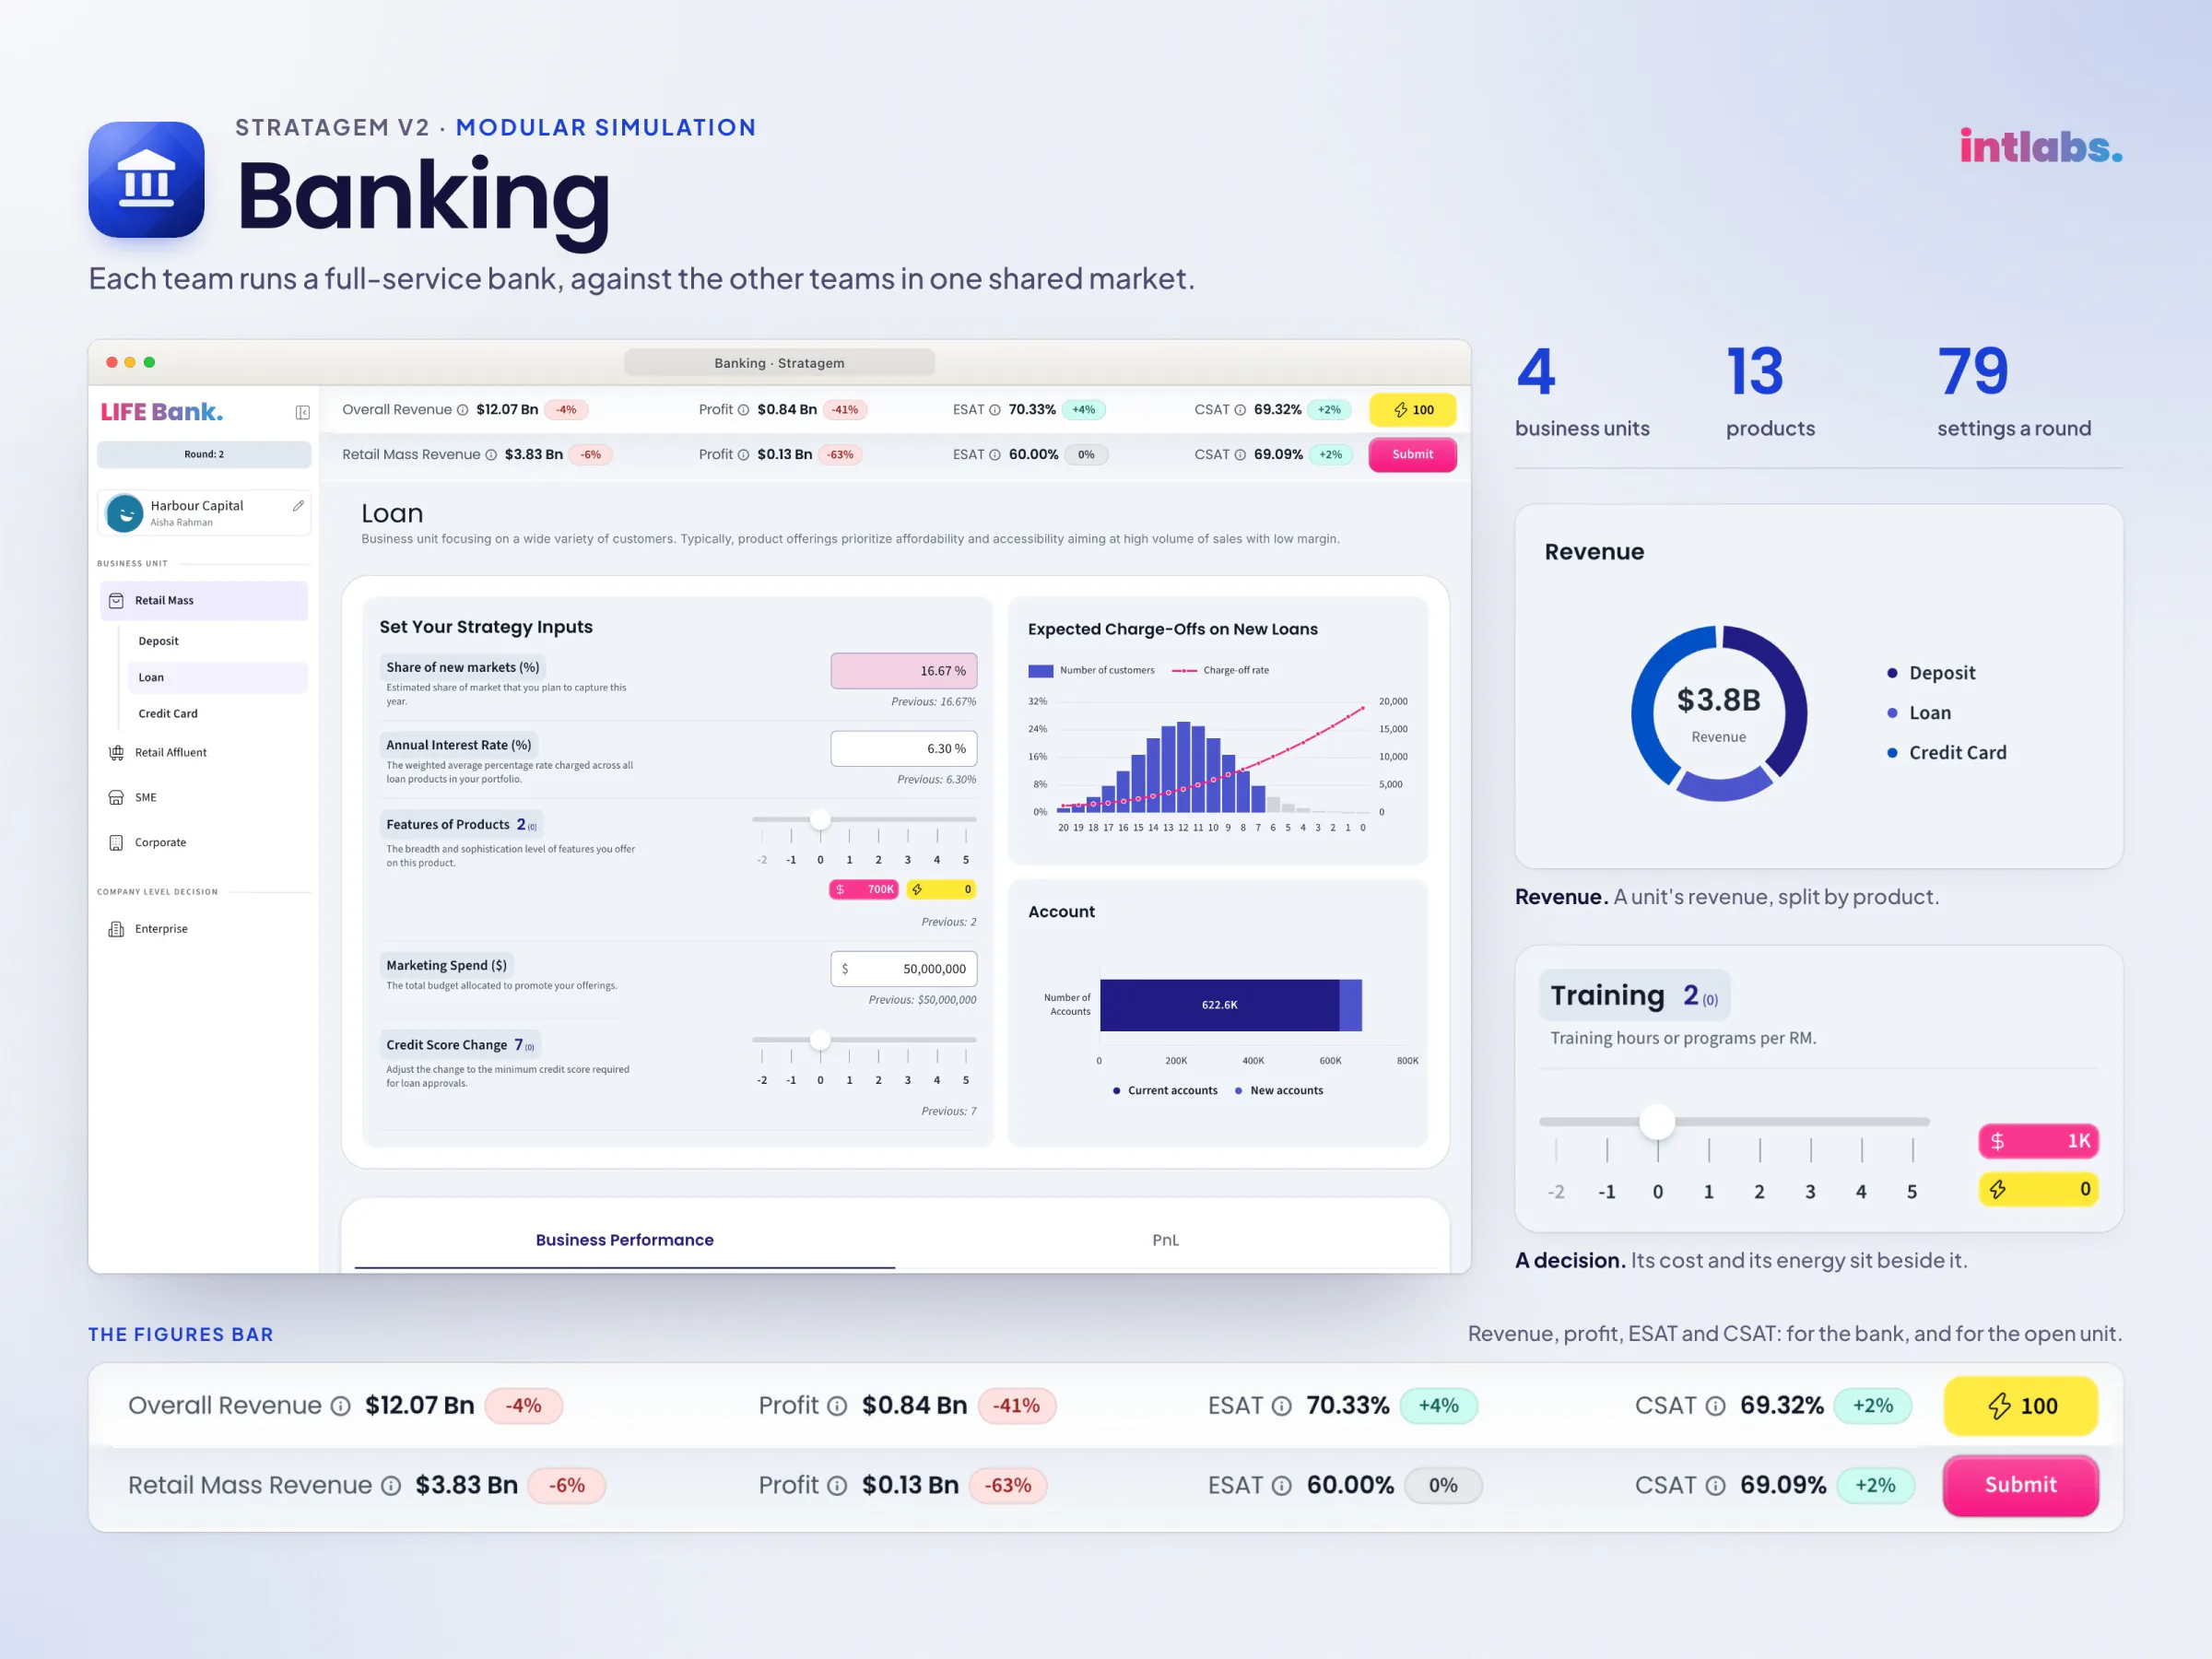
A Banking poster: the Loan page in a window, a revenue donut, a decision tile and a figures bar; 4 units, 13 products, 79 settings.
18Banking on one sheet
19 · VideoA team's Banking round
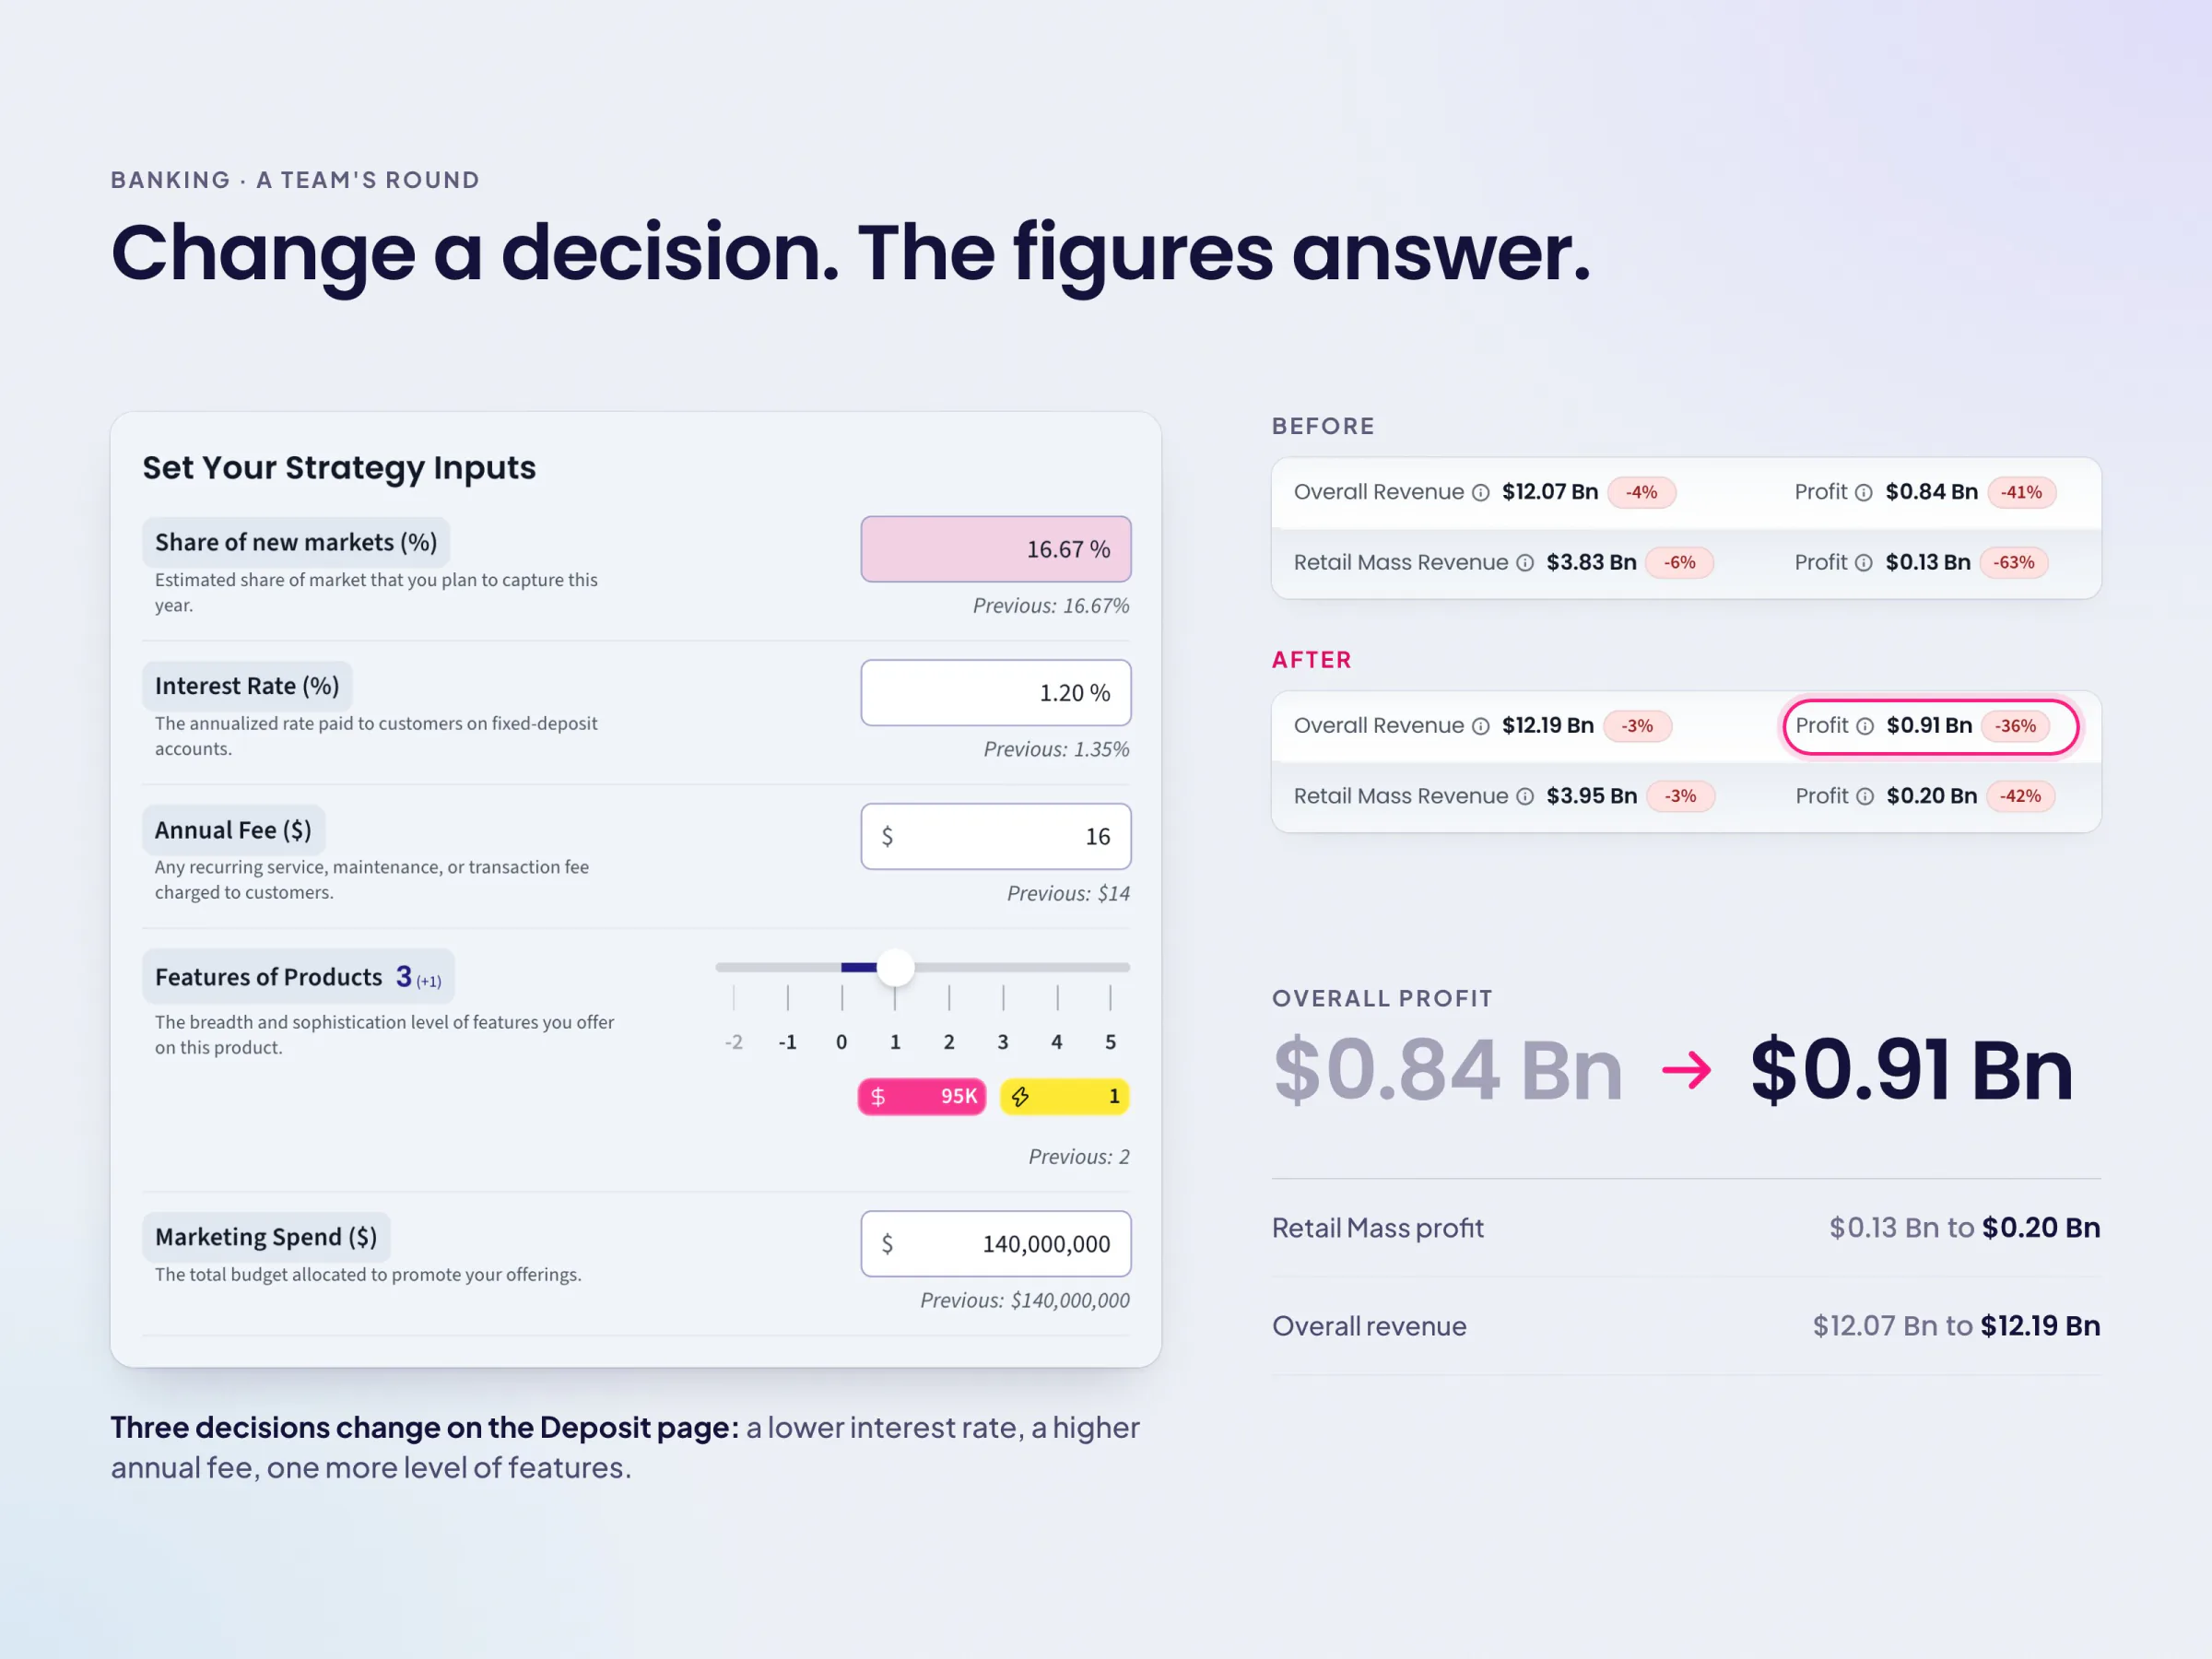
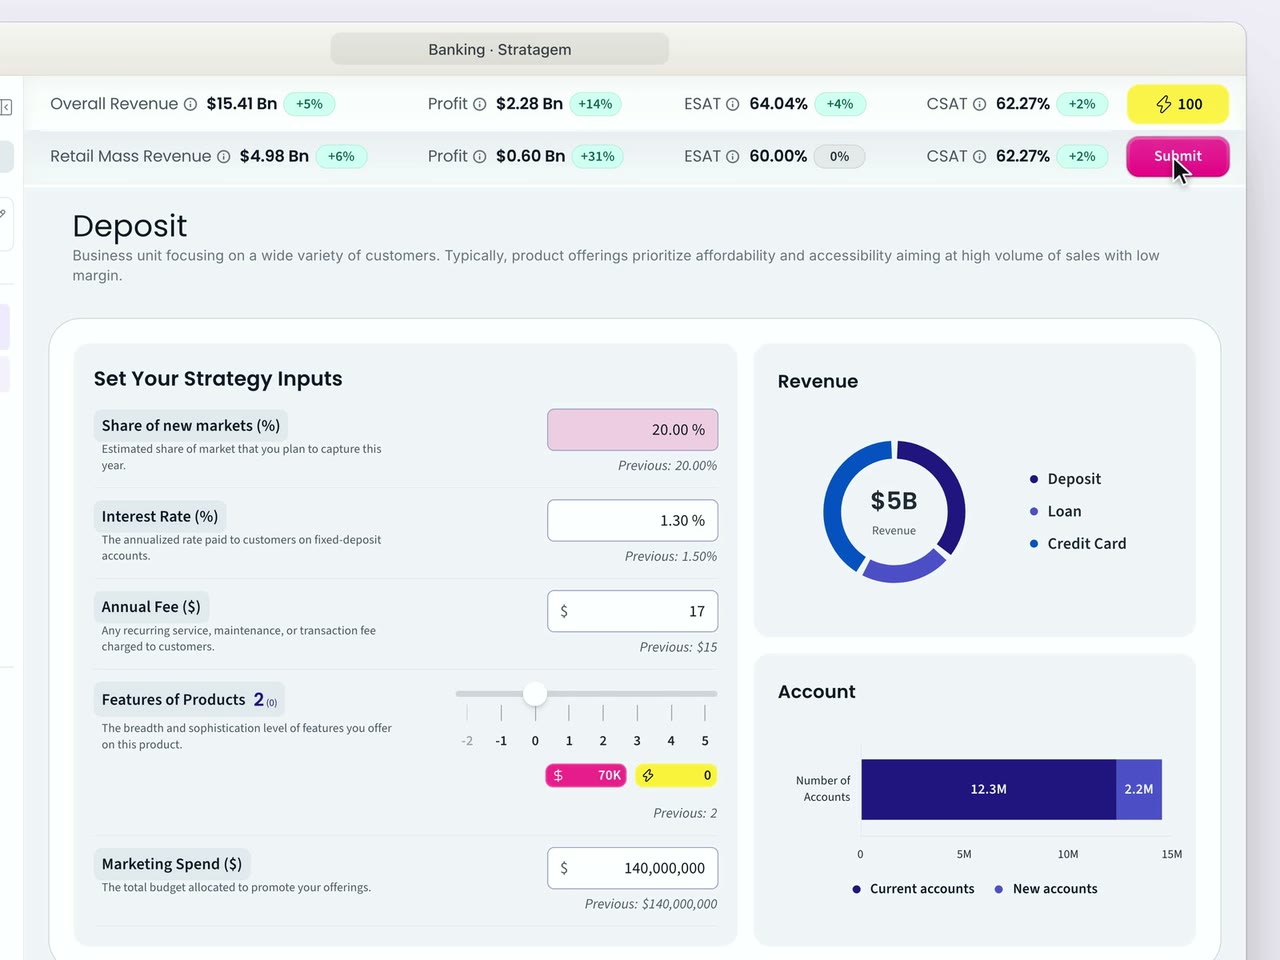
Banking's Deposit inputs with the figures bar before and after three changes; overall profit moves from $0.84 Bn to $0.91 Bn.
20Change a decision. The figures answer.
Banking's Loan page twice, side by side: on MUI on 25 September 2026, and on the design system on 29 September 2026.
21The same page, before and after the move to the design system
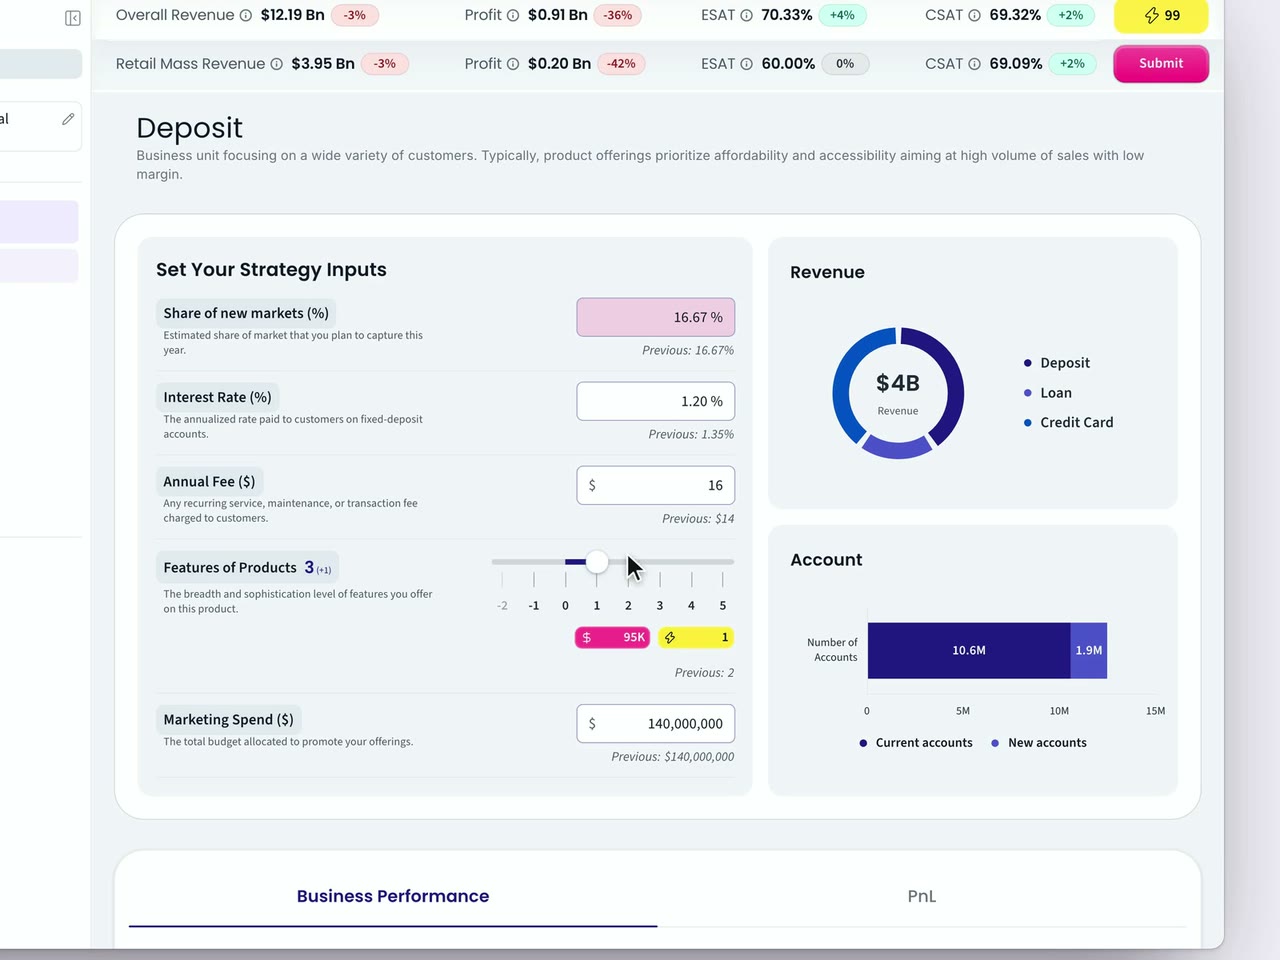
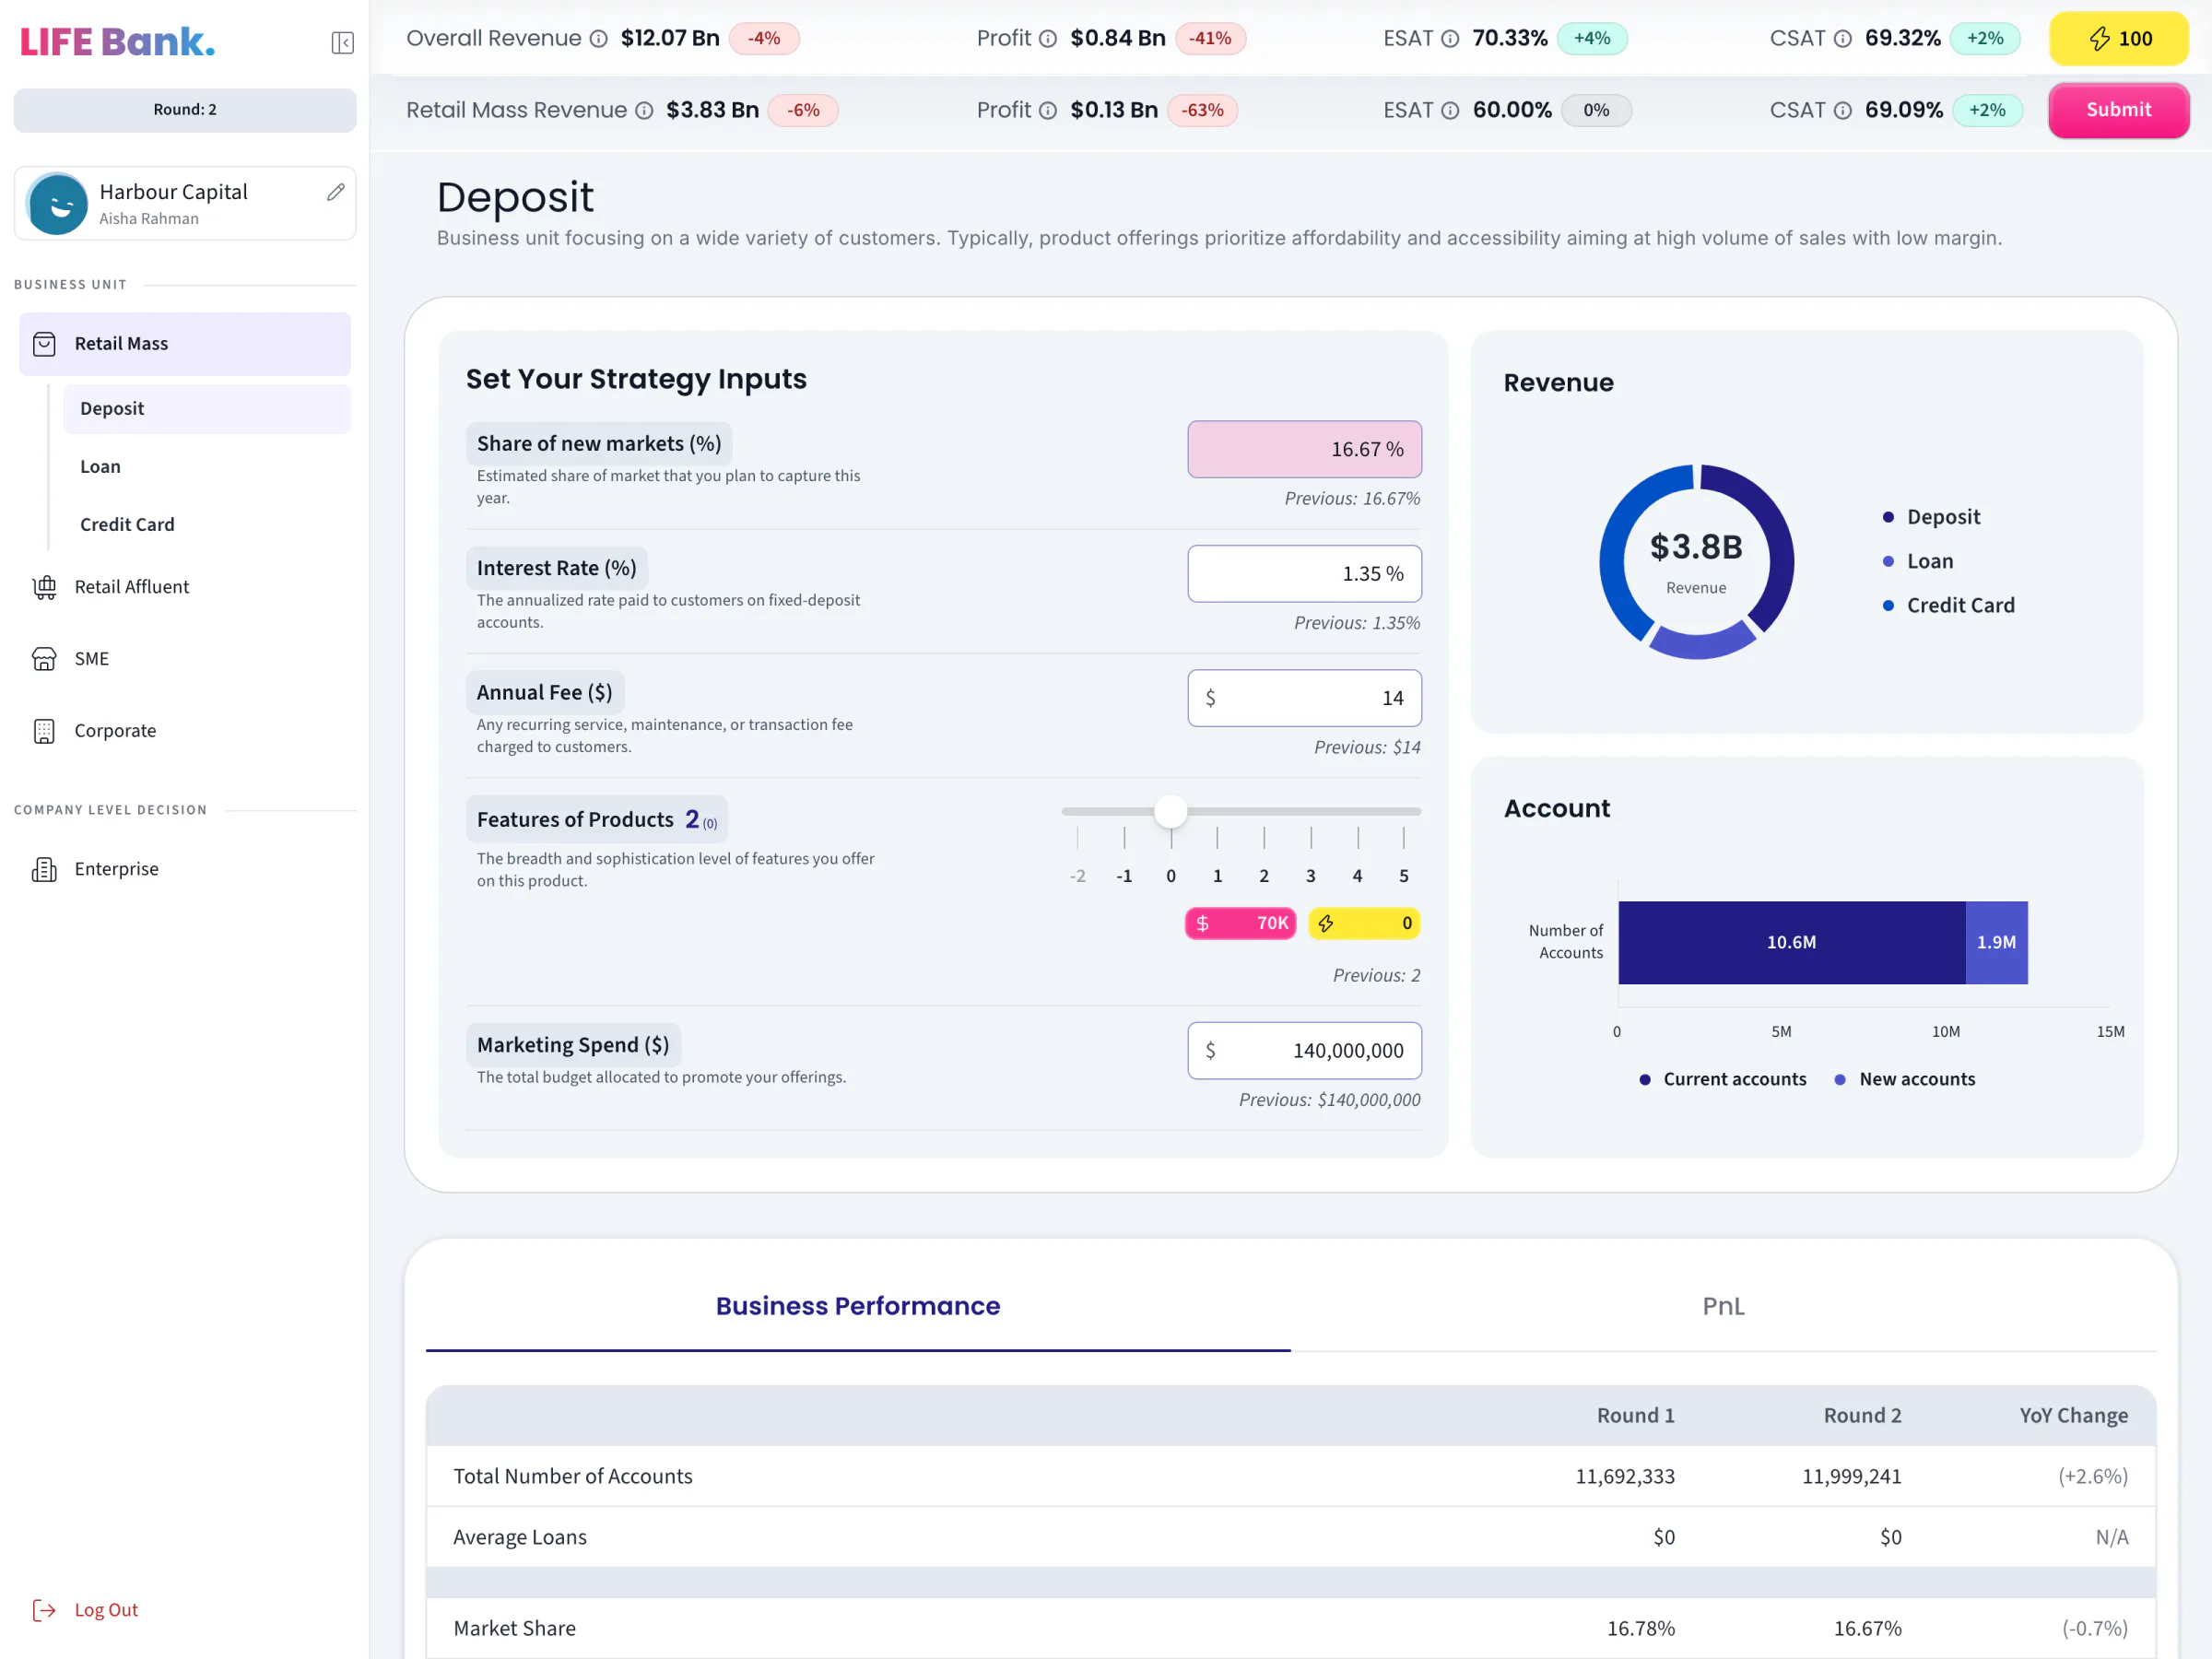
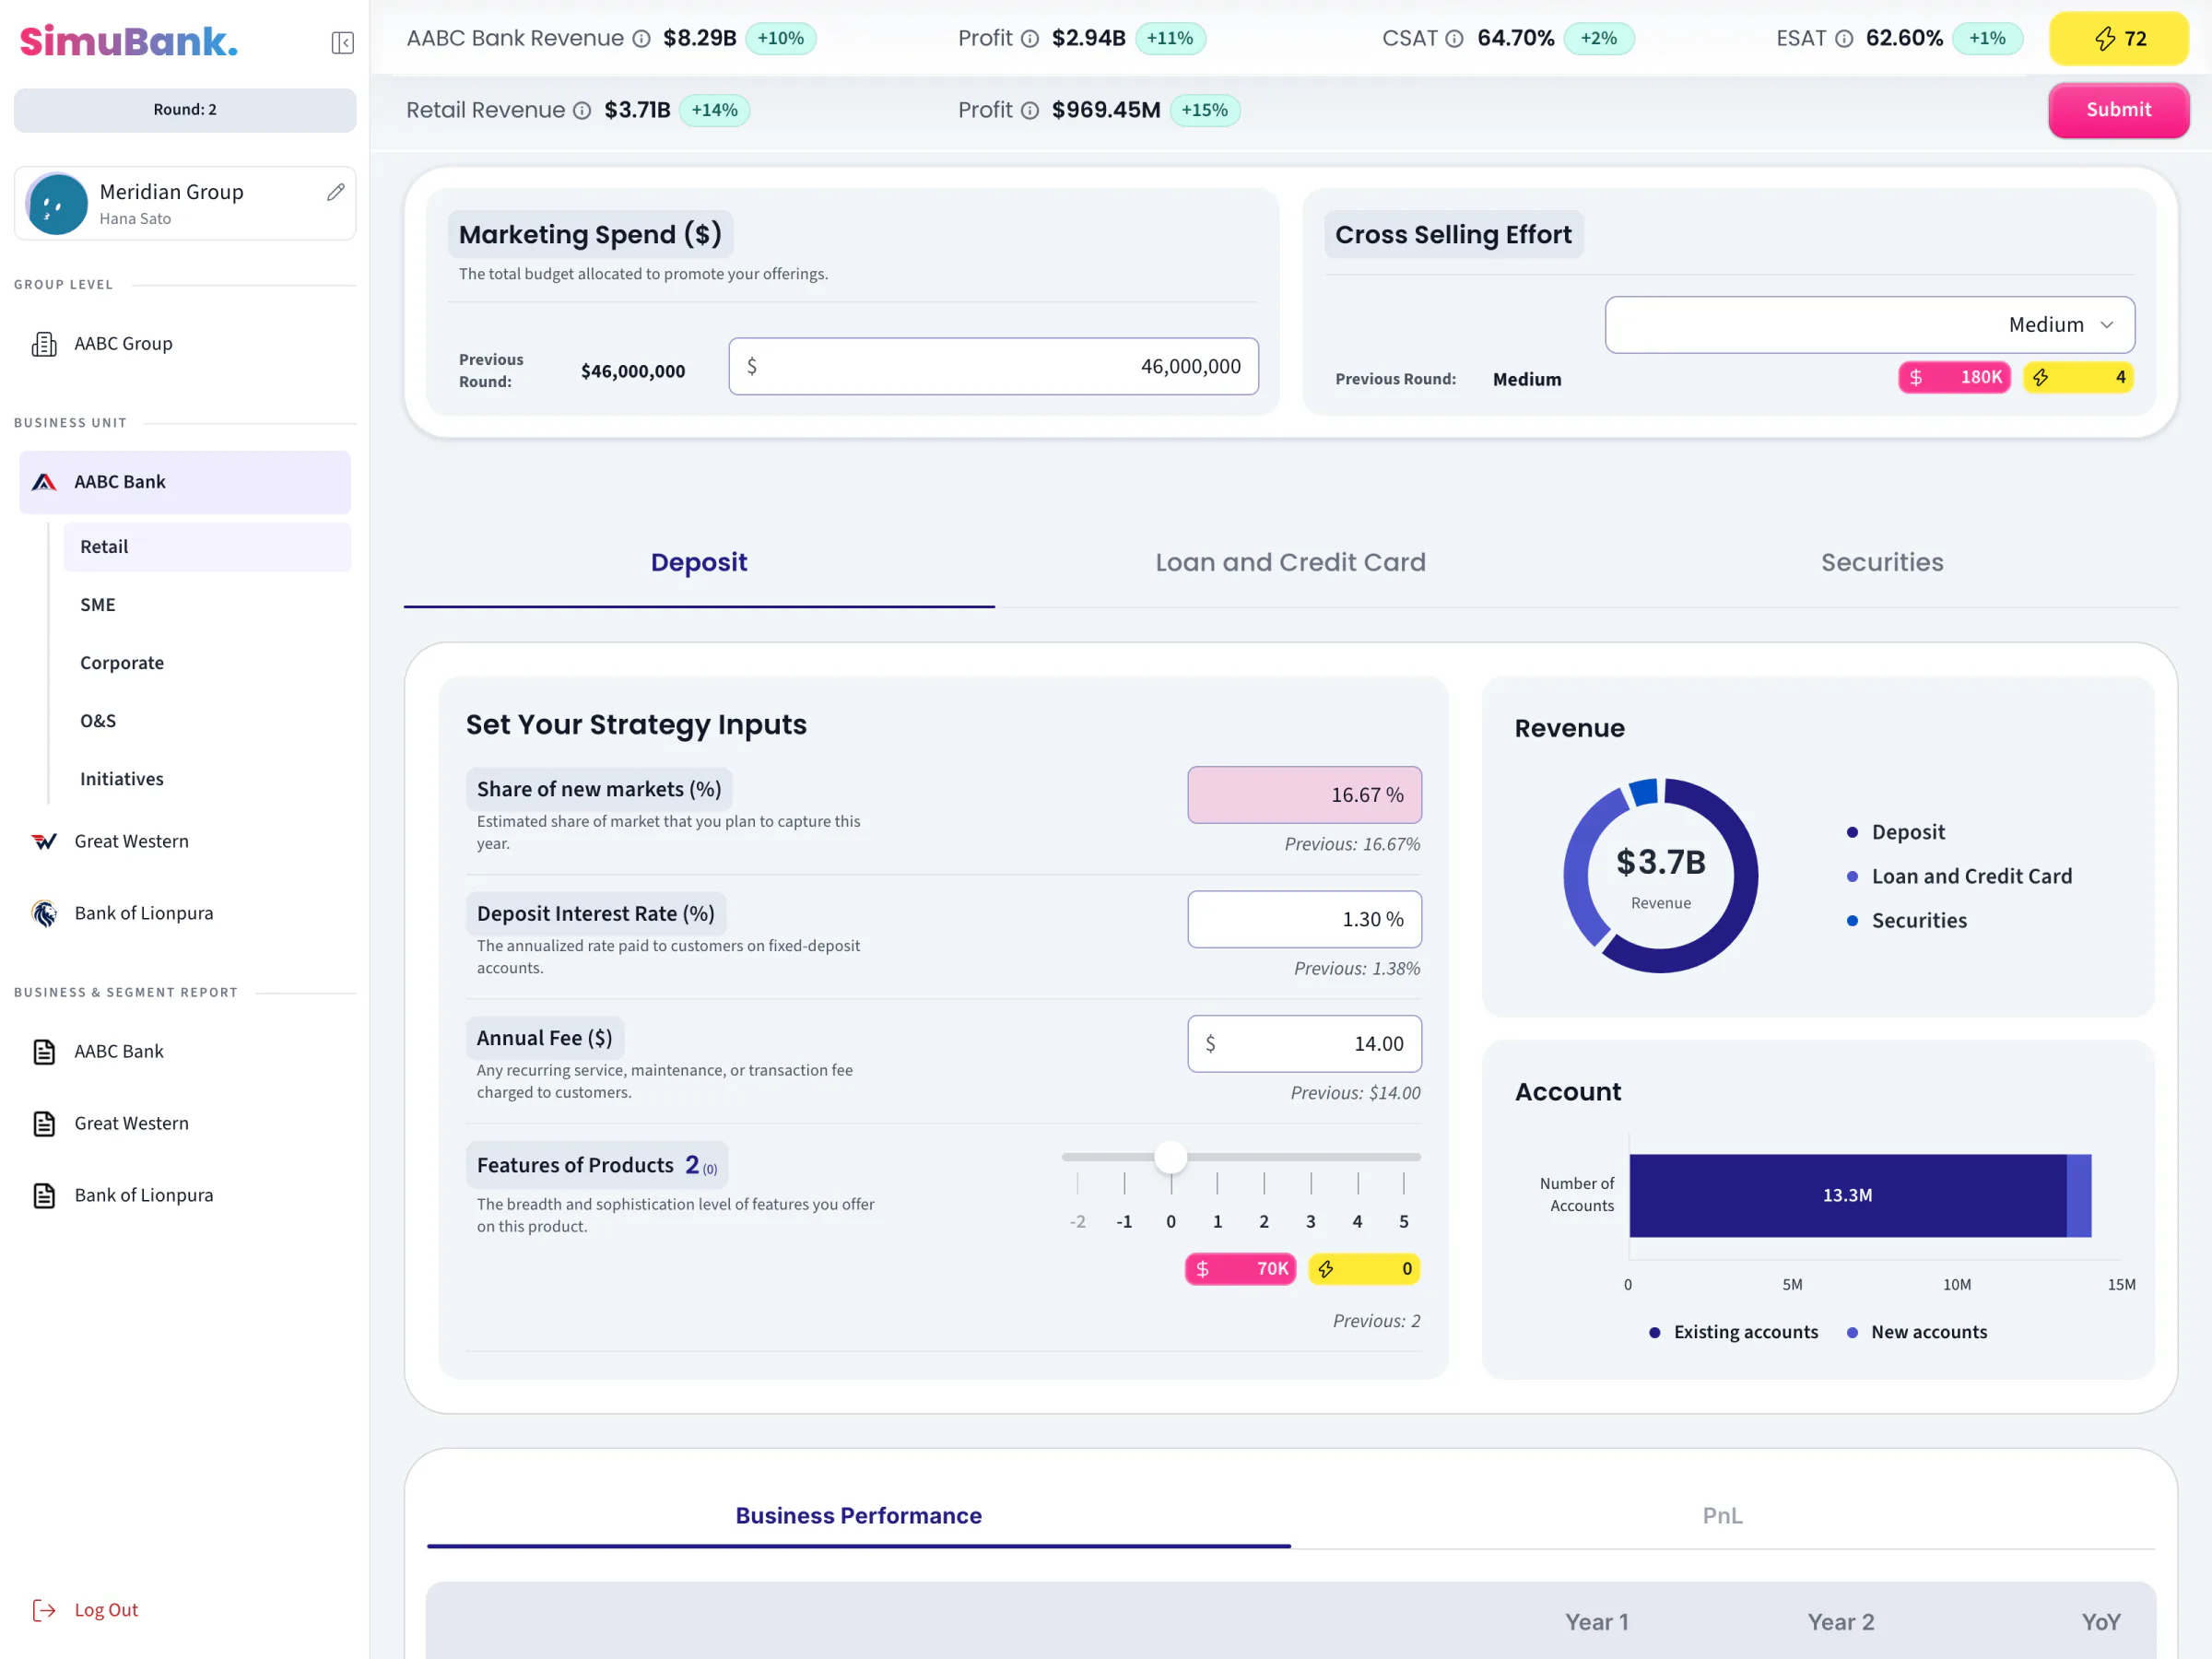
A bank's Deposit page: five strategy inputs, a revenue donut of $3.8B, an account chart, and a figures bar showing $12.07 Bn revenue.
22The Deposit page: decisions with their charts beside them
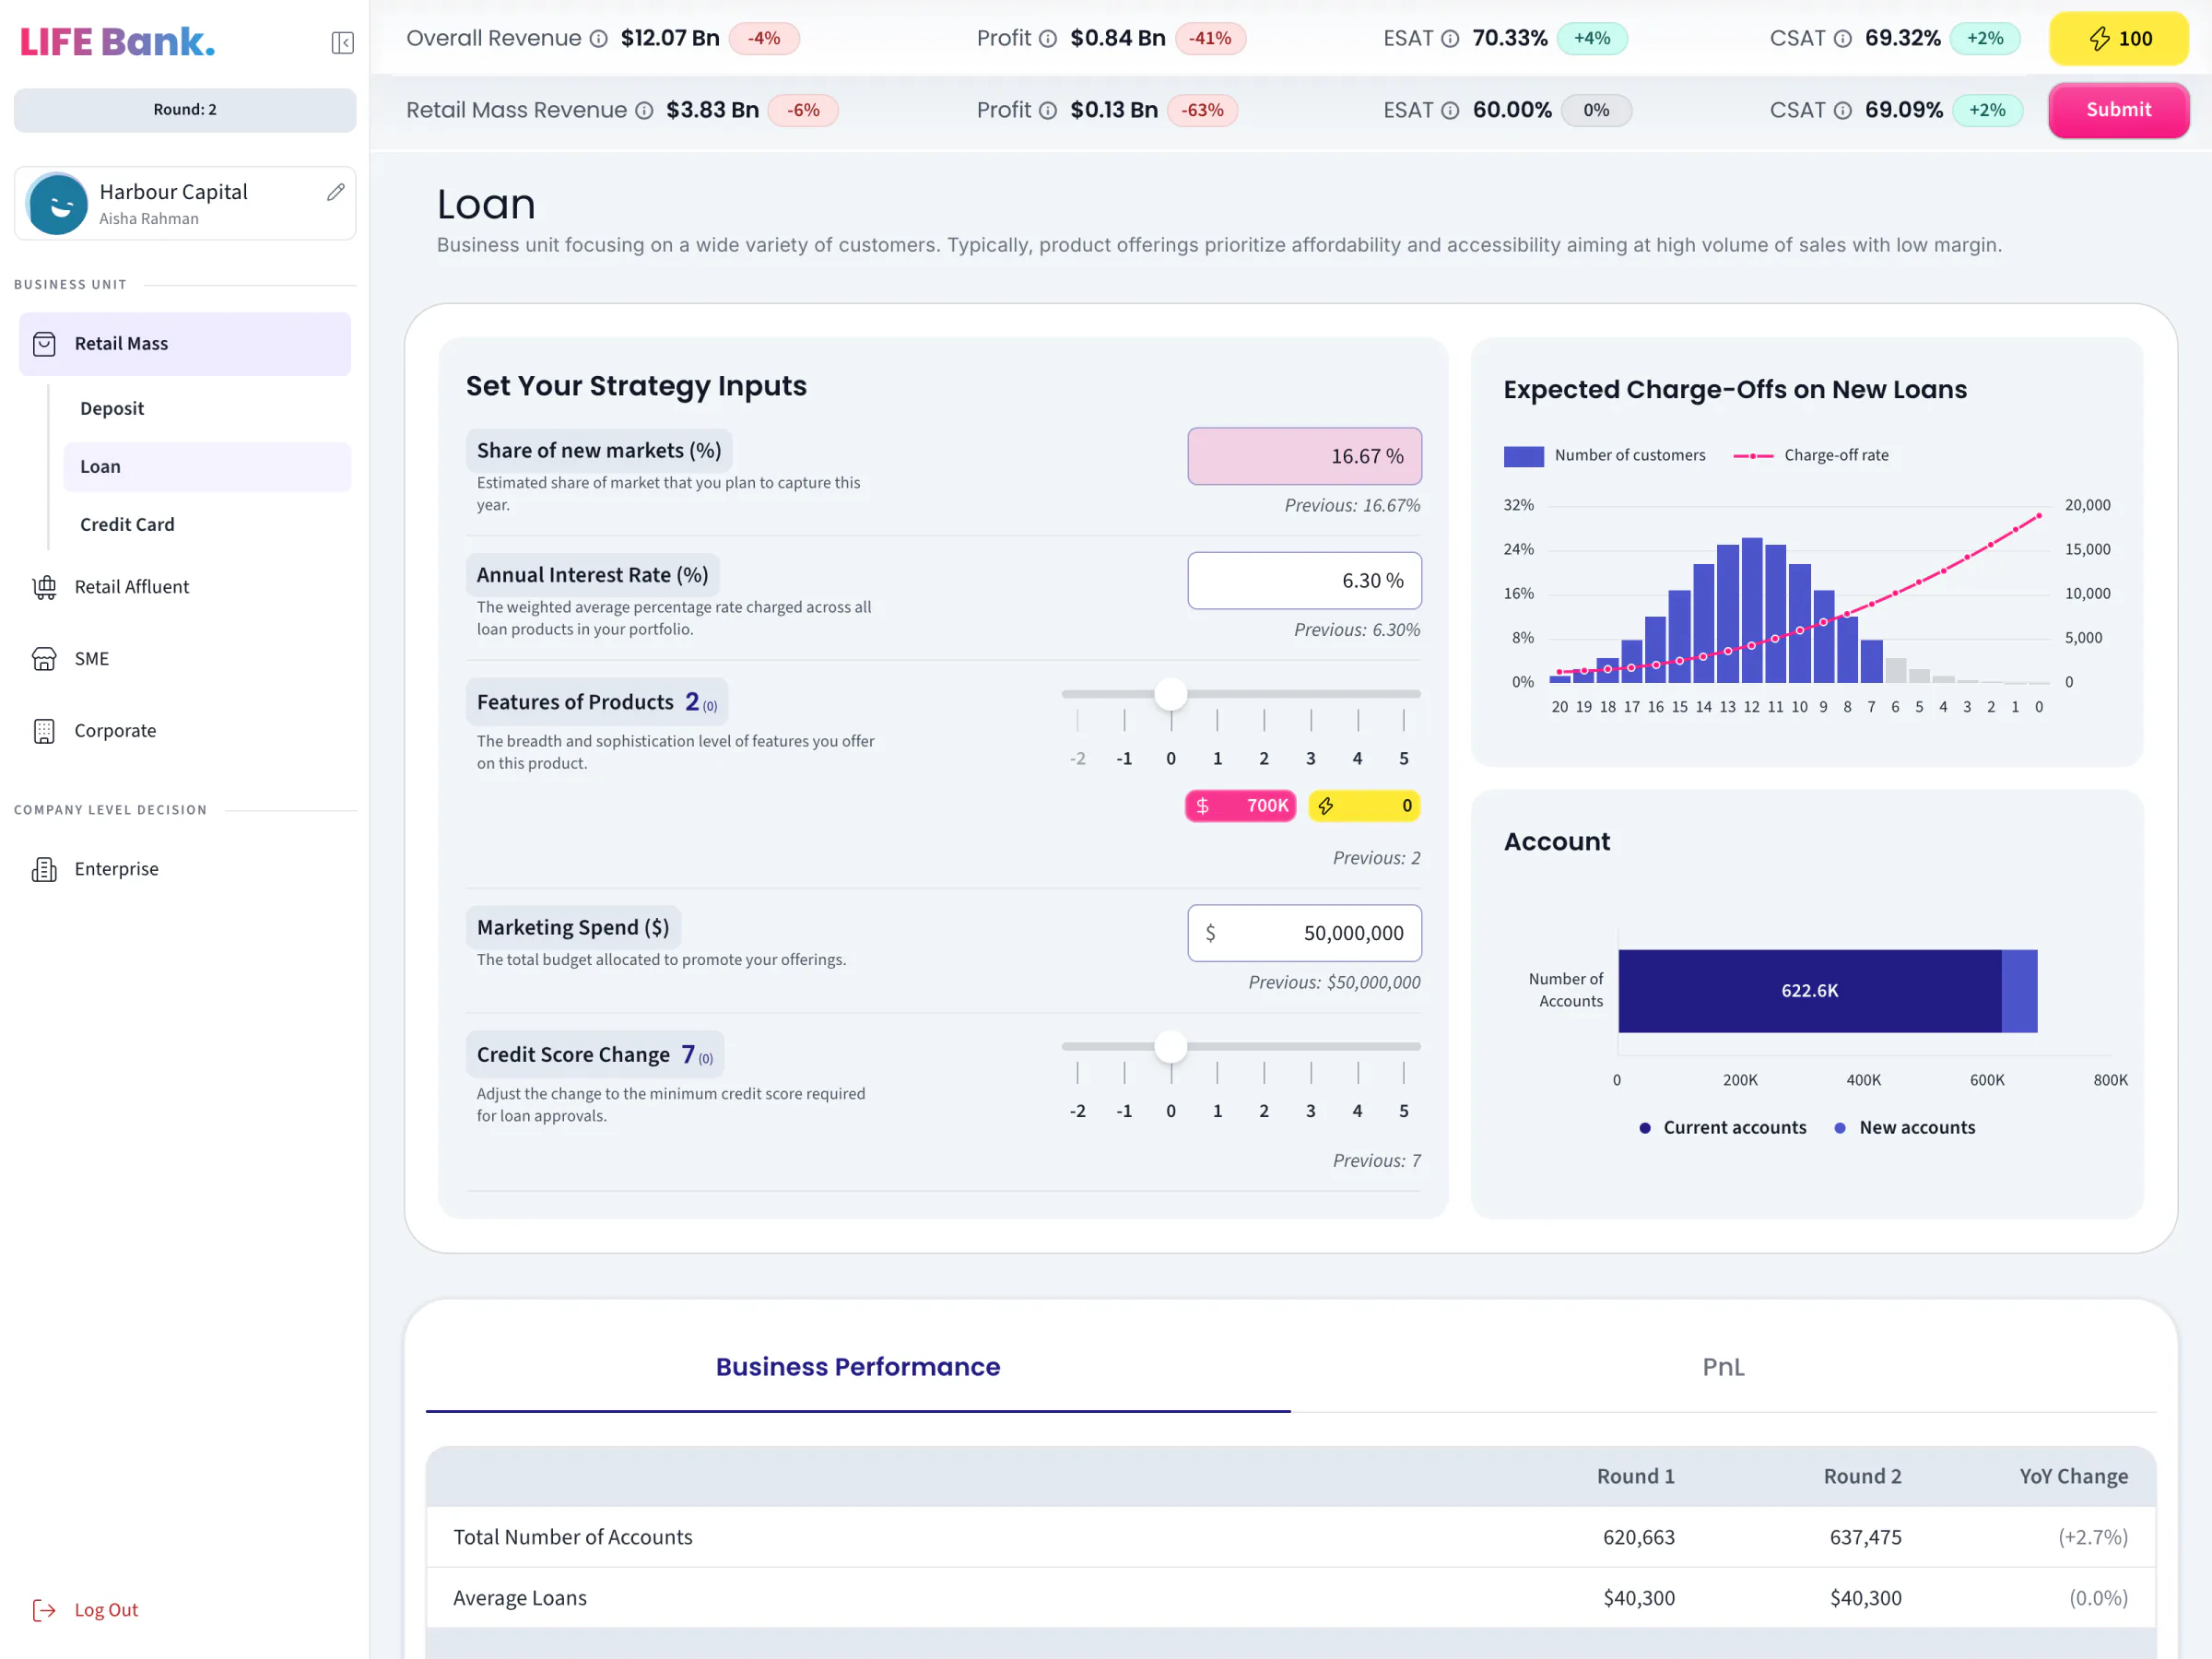
The Loan page: inputs with a rate of 6.30%, beside a chart of expected charge-offs on new loans and an account chart.
23The Loan page and its expected charge-offs
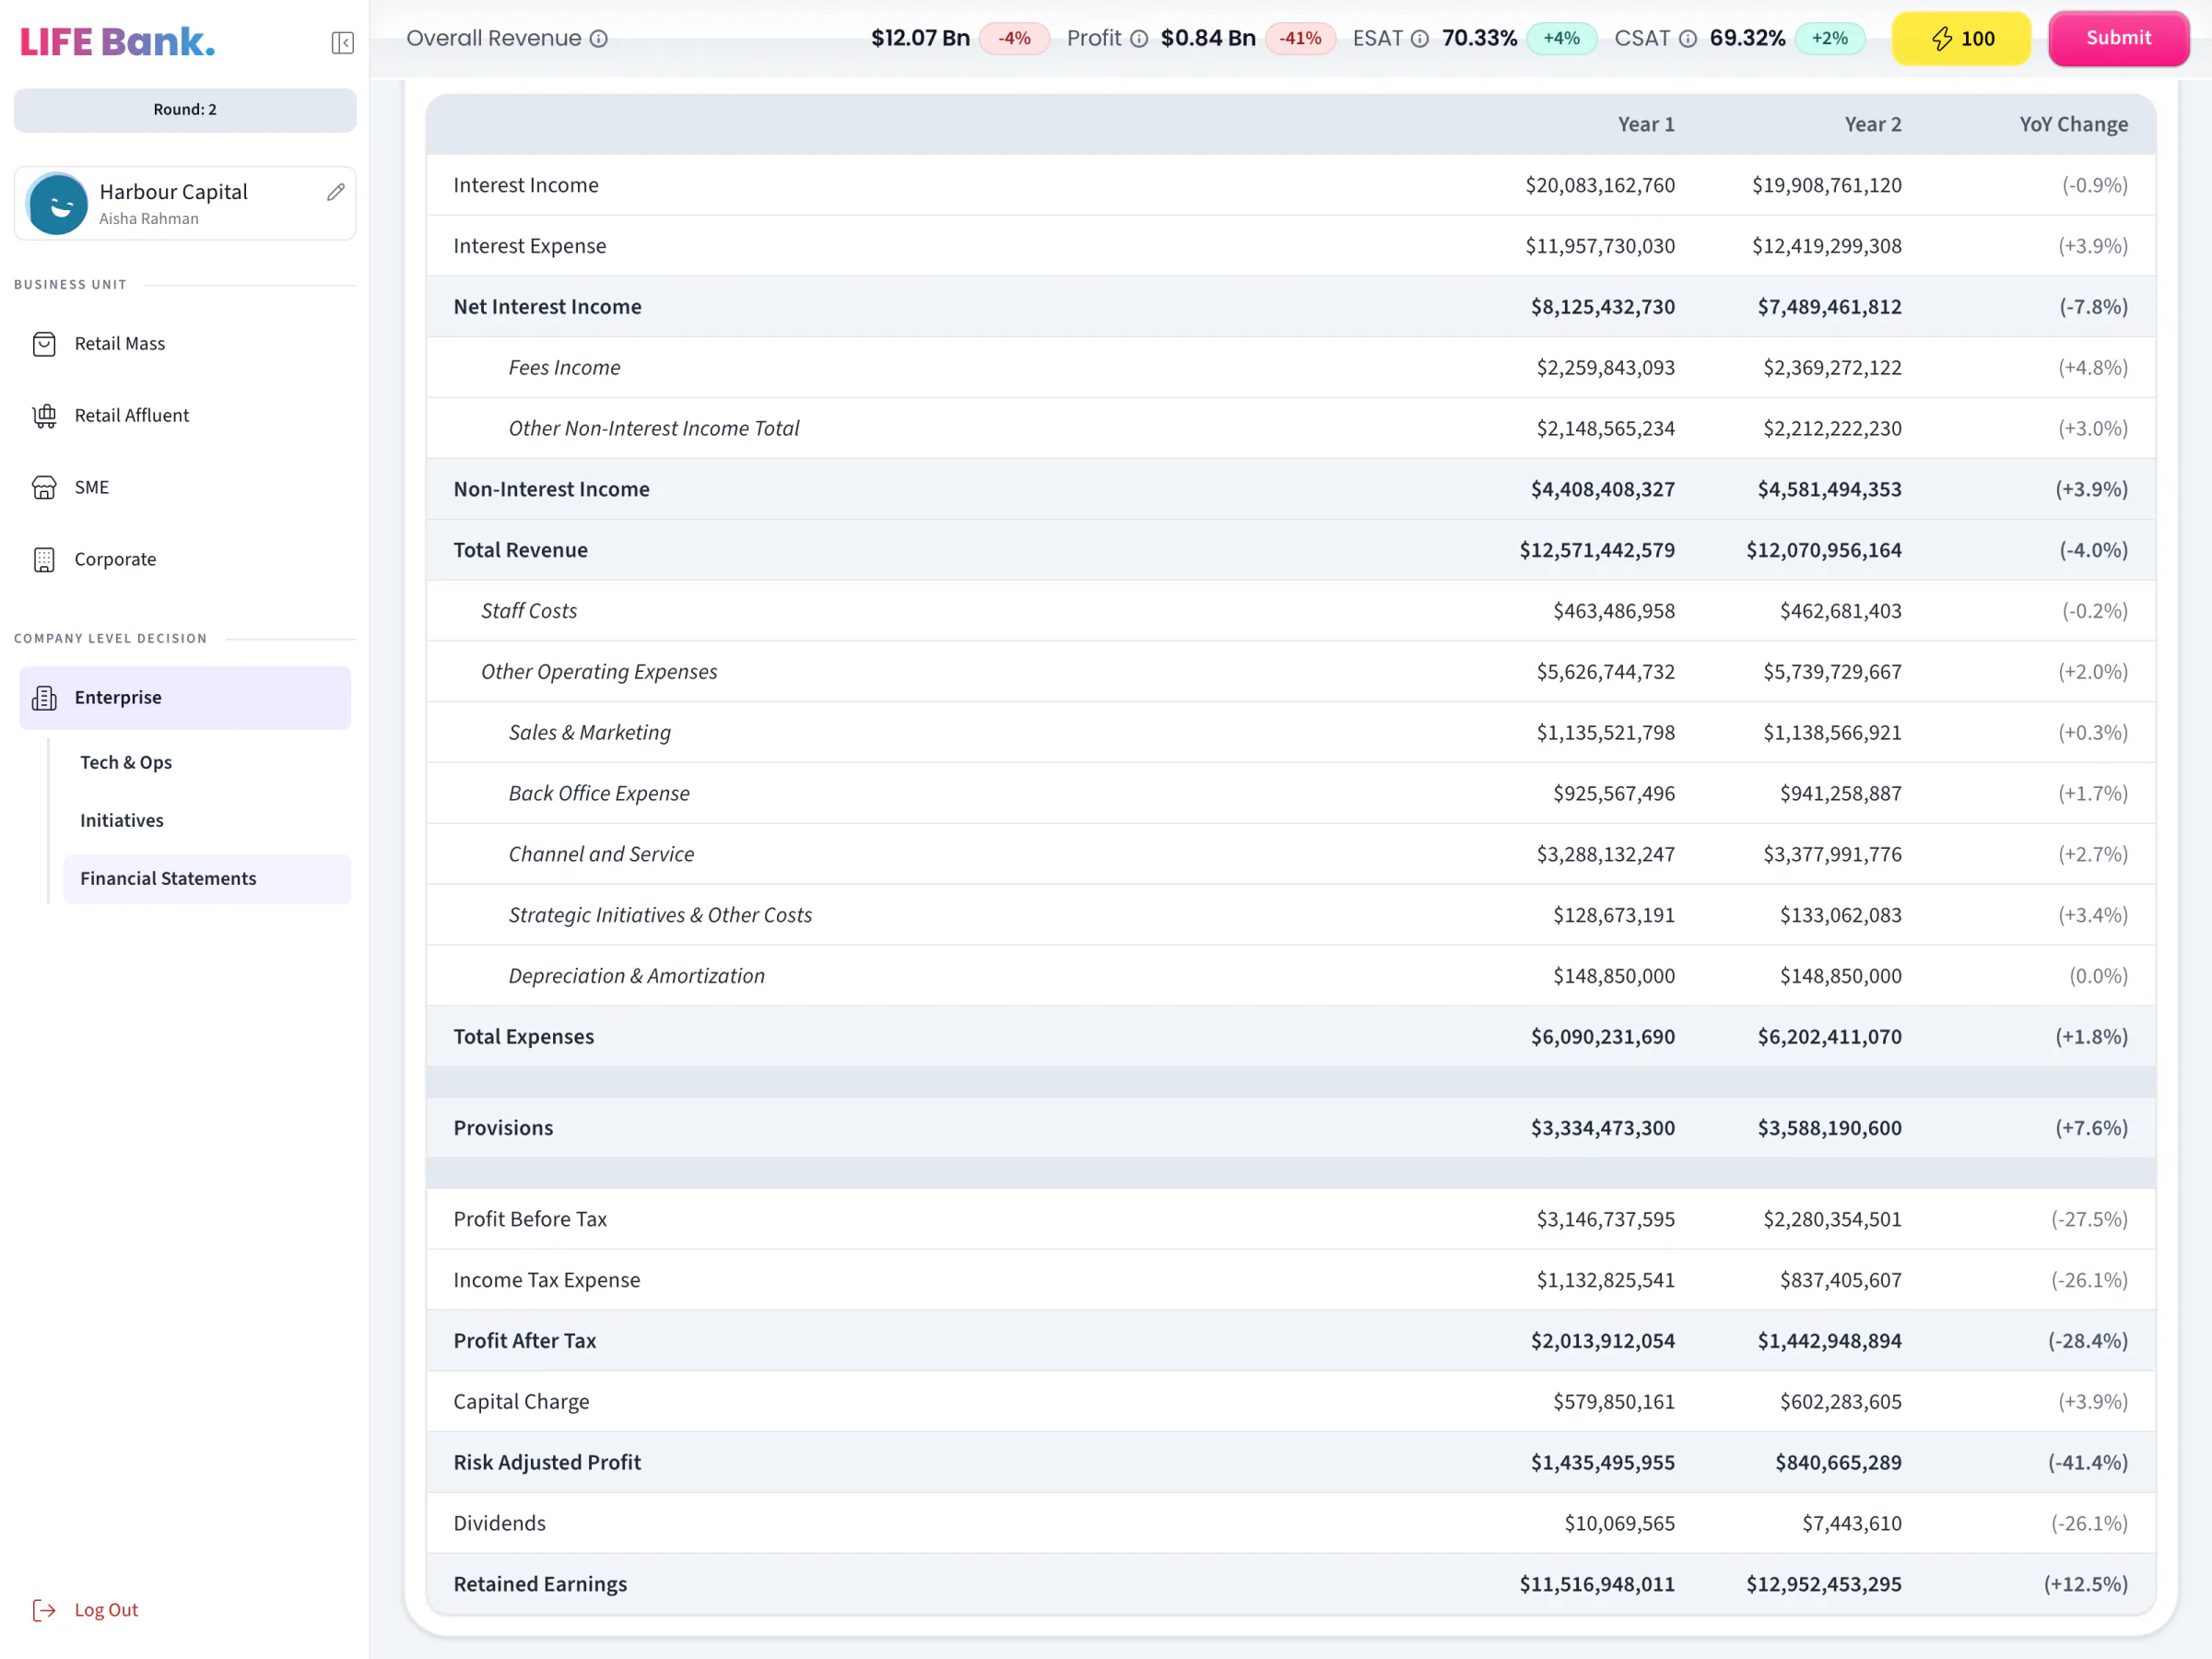
The whole PnL: total revenue falls from $12,571,442,579 to $12,070,956,164, and risk adjusted profit by 41.4%.
24The PnL, whole
A donut chart titled Revenue with $3.8B in its centre, split across Deposit, Loan and Credit Card.
25The Revenue donut
A chart titled Expected Charge-Offs on New Loans: blue bars of customers by credit score, and a pink charge-off rate line.
26Expected charge-offs on new loans
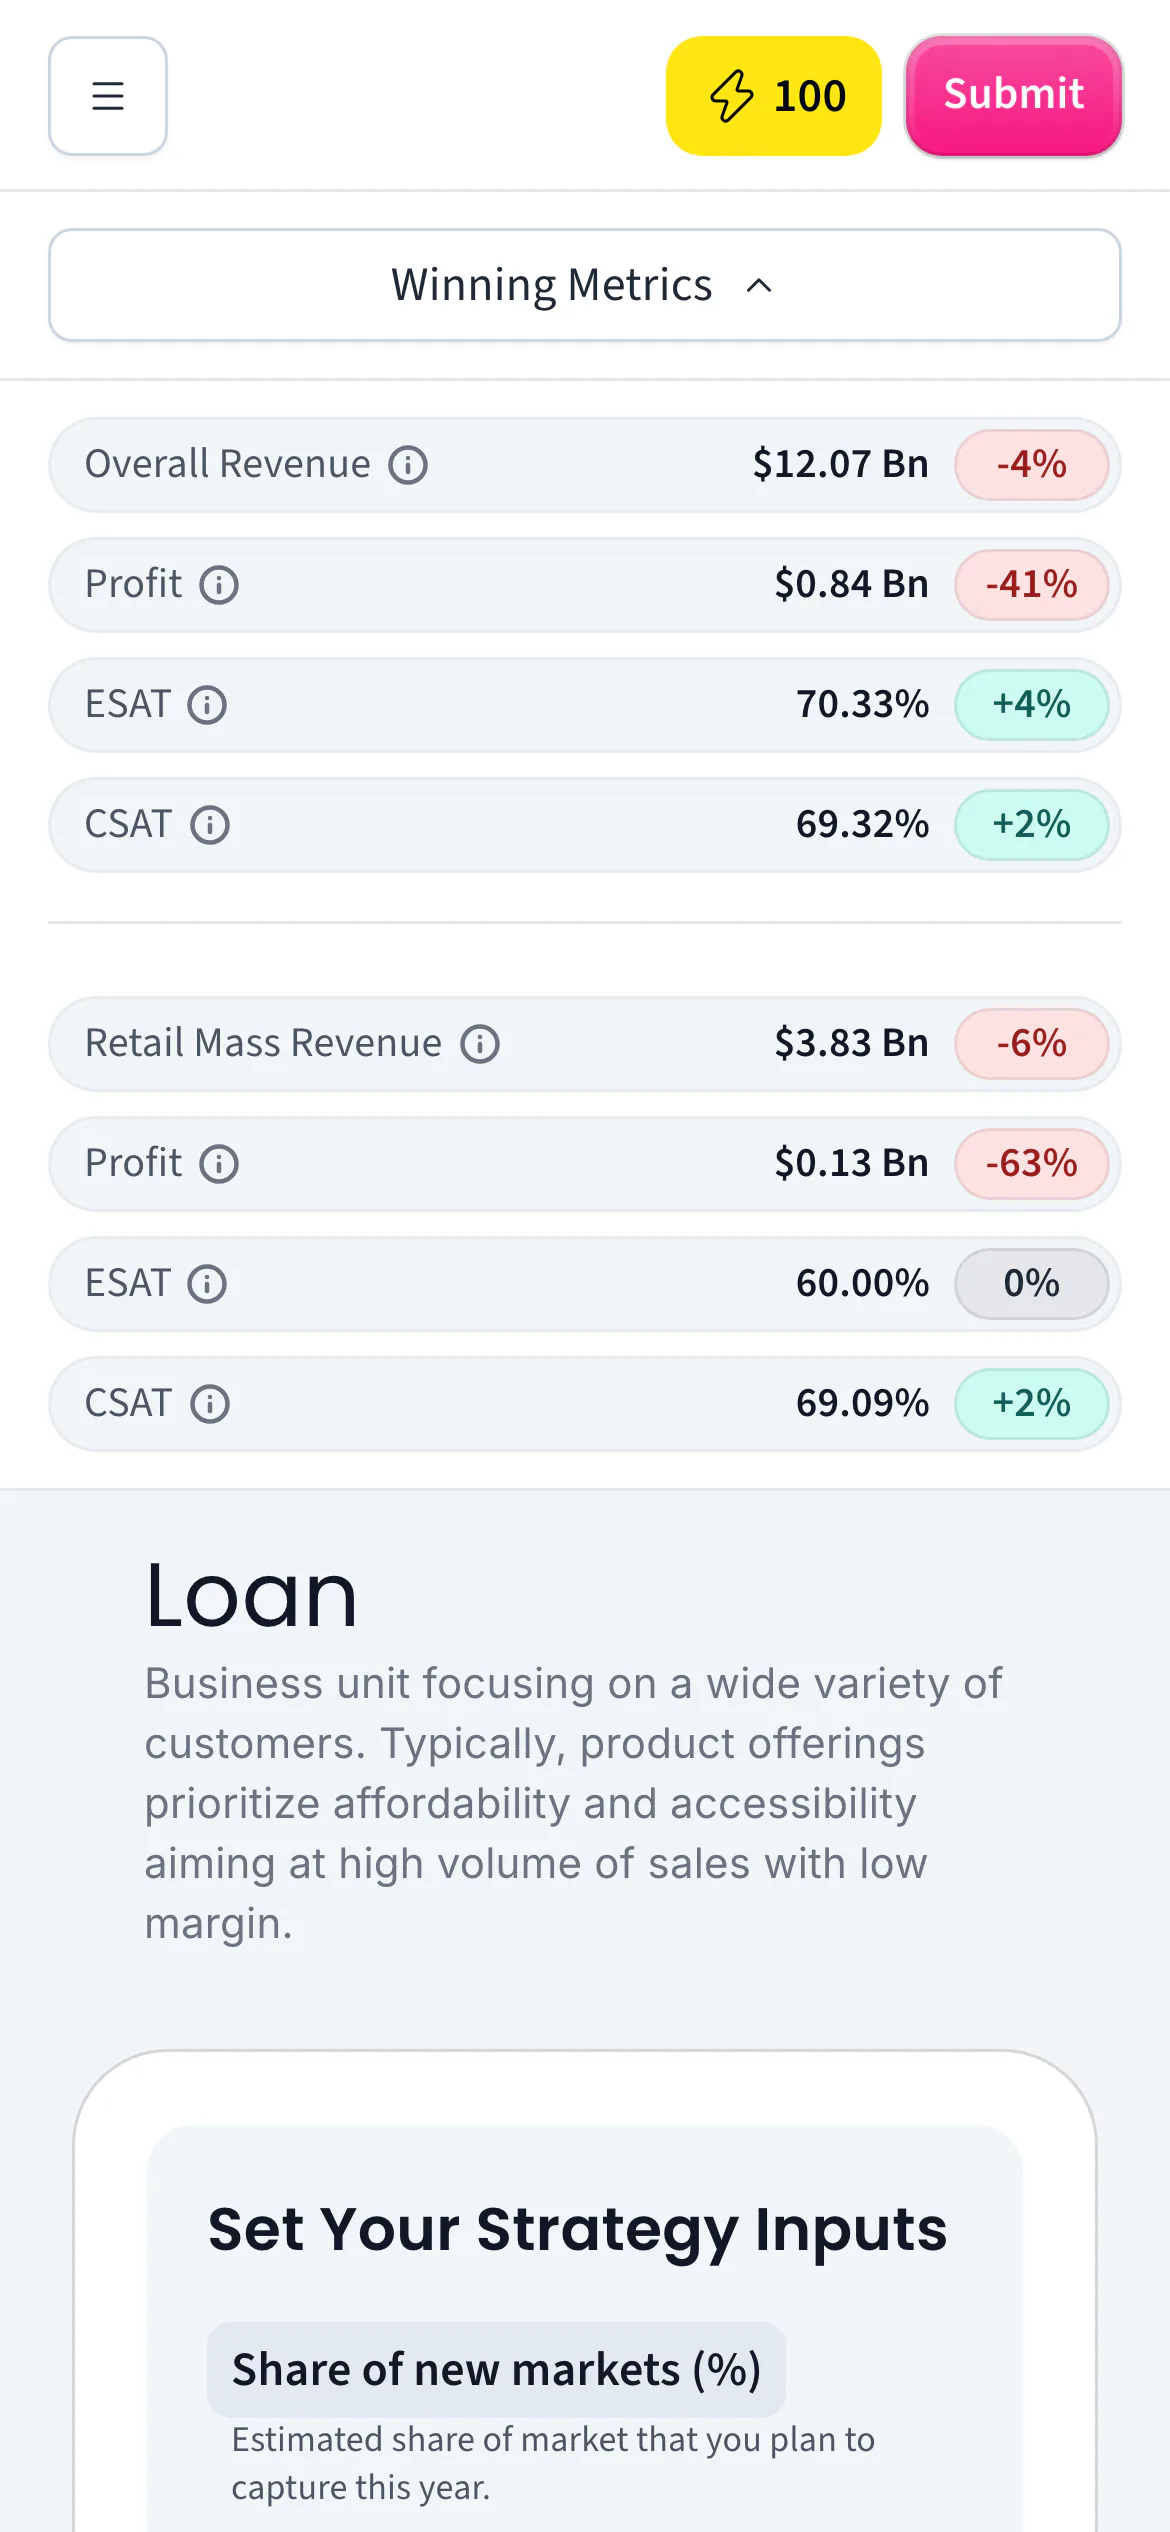
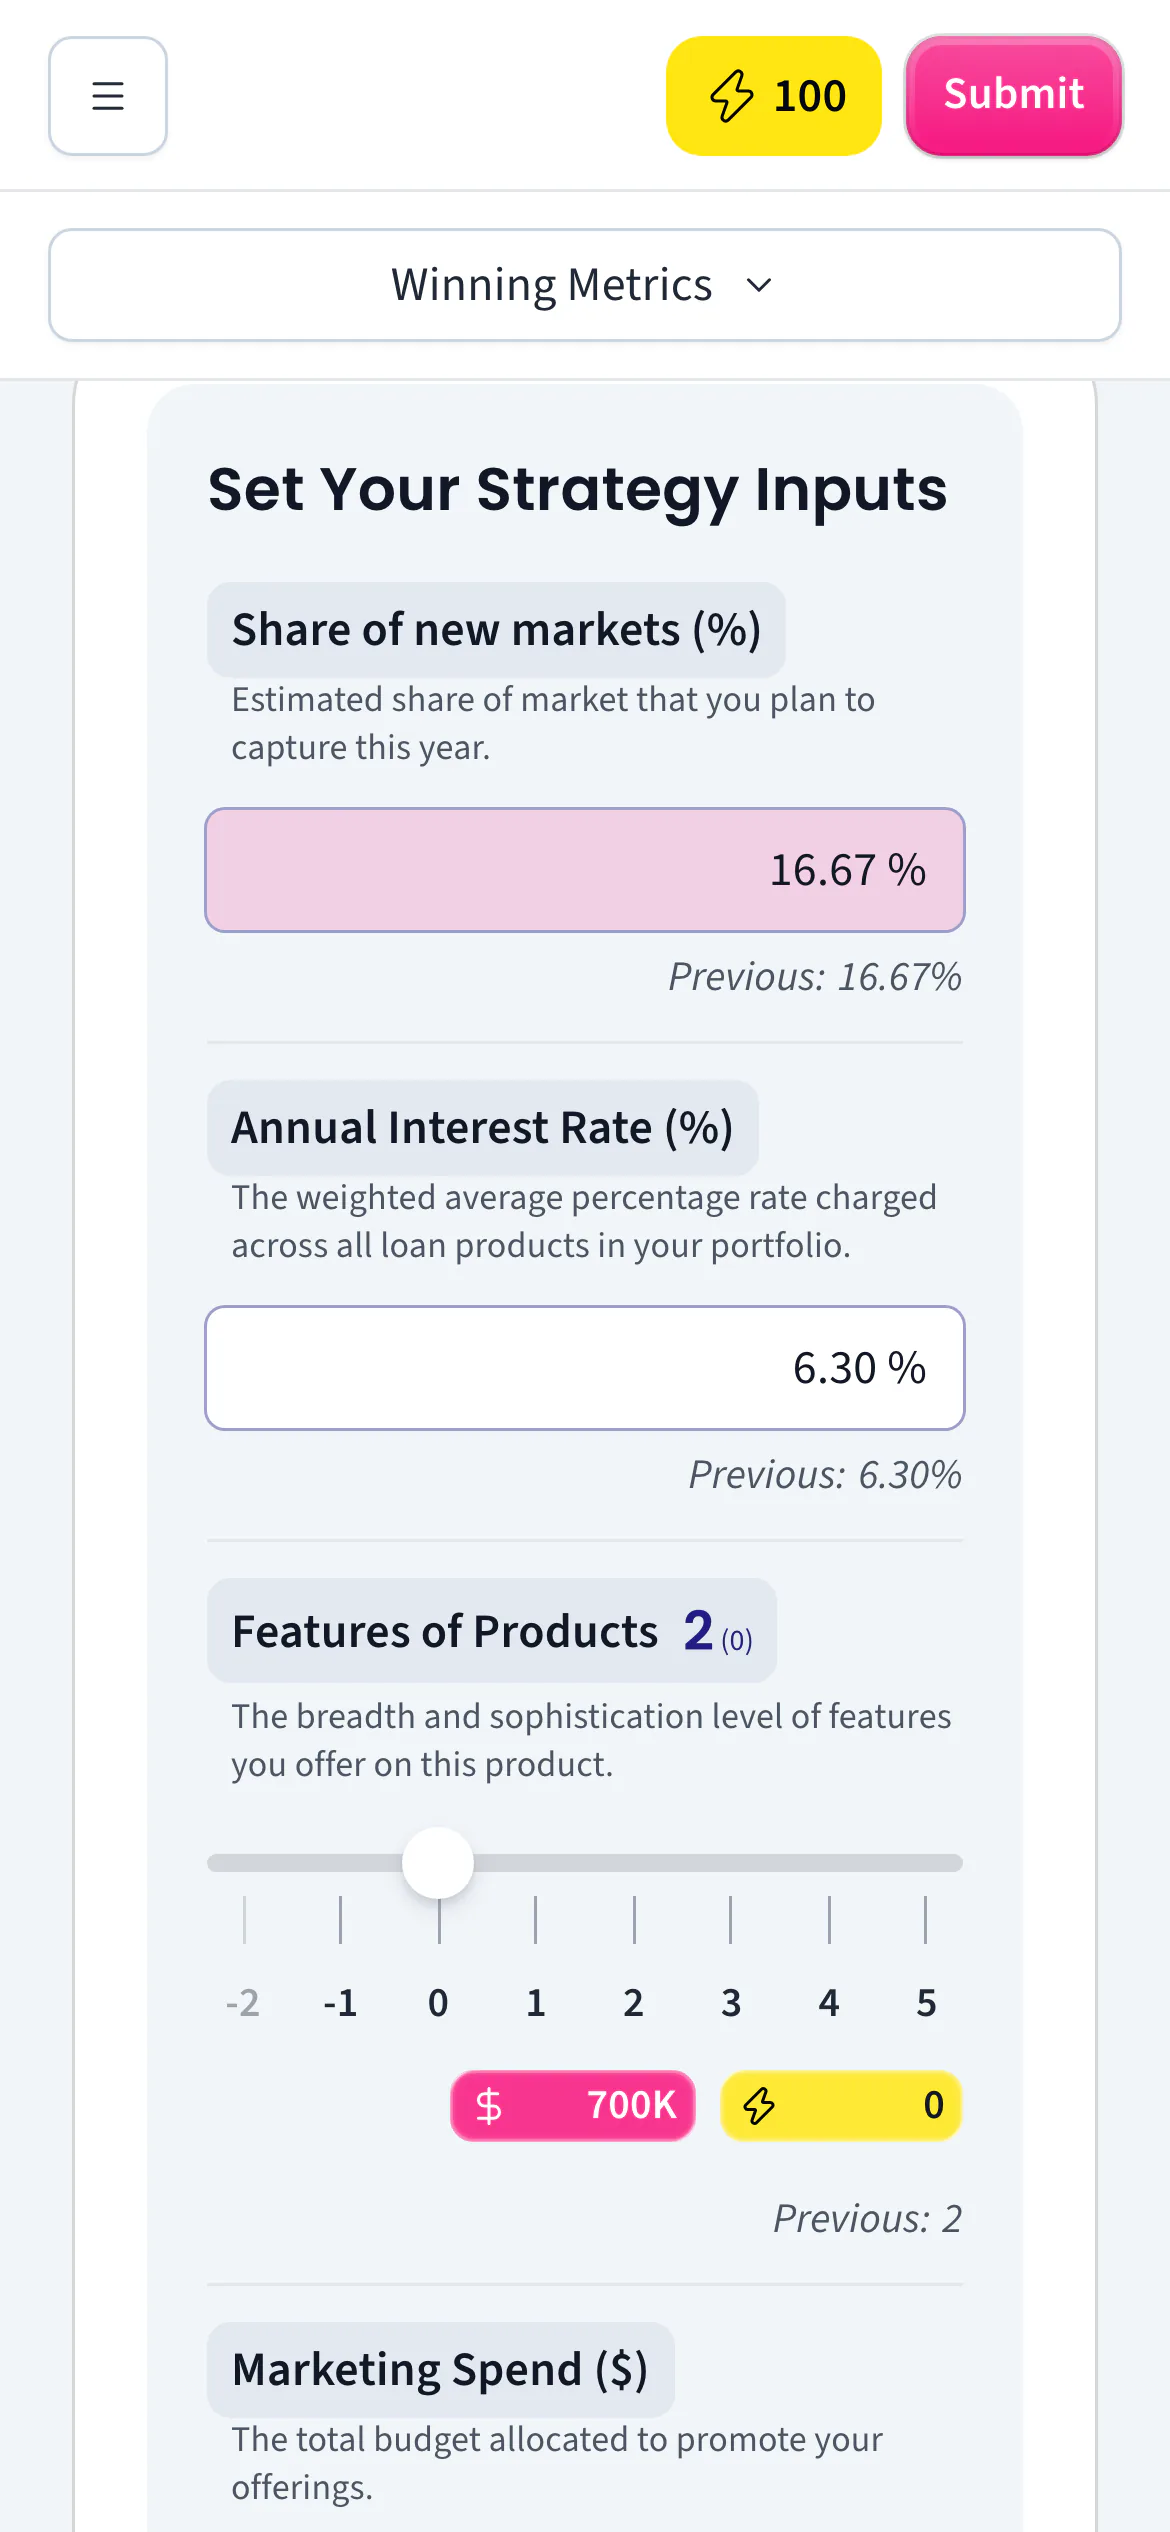
A phone screen: Winning Metrics open, revenue $12.07 Bn, profit $0.84 Bn, ESAT 70.33%, CSAT 69.32%, then the unit's four figures.
27On a phone: the winning metrics
A phone screen: the Loan page's strategy inputs, share 16.67%, rate 6.30%, and a features slider with cost and energy chips.
28On a phone: the strategy inputs
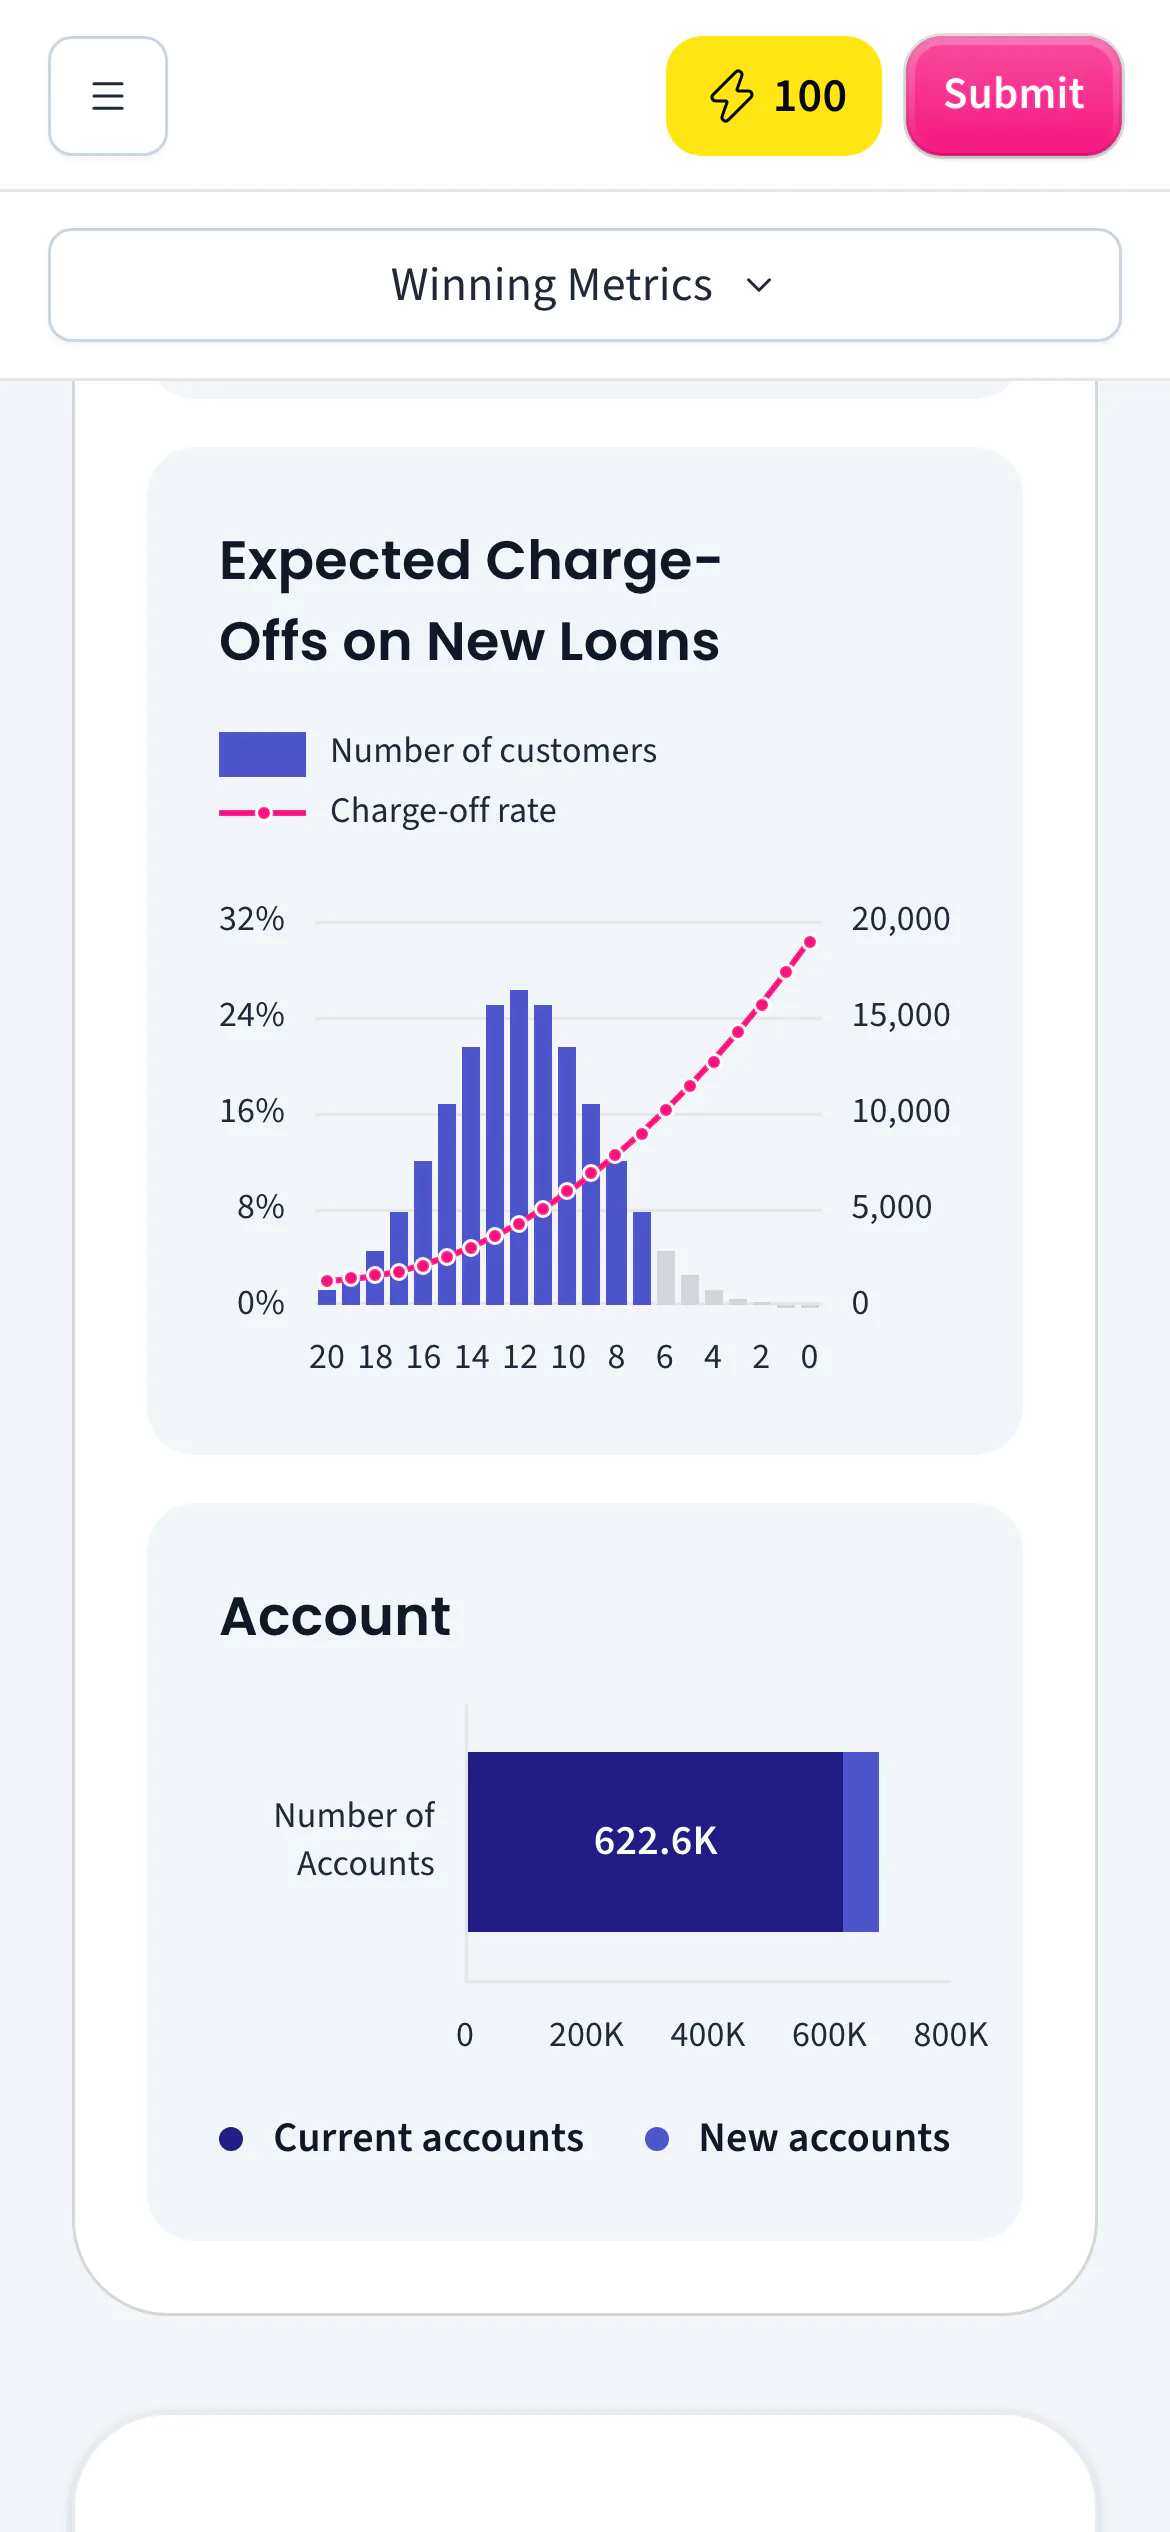
A phone screen: a chart of expected charge-offs on new loans, and an account bar showing 622.6K.
29On a phone: the charts
04

ET Prime: Run a Financial Group

Each team sits on the board of AABC Group, a fictional group with a commercial bank, an insurer and a private bank. Over three financial years it shapes 17 products in six segments, invests in operations and people, and picks initiatives. Each unit has its own industry's profit and loss model, and the group's statements are built from the three. The engine's rule is that accounting identities always hold, and they are written as named tests. The player is partly on the design system: the frame, the decisions and the charts have moved, while the group page and the statements are still MUI.

  • 3 business units, 6 segments, 17 products, 107 input fields.
  • Three profit and loss models, eleven cross-selling routes, and identities held by tests.
  • Honest status: 53 server suites are quarantined, and the identity tests are not among them.
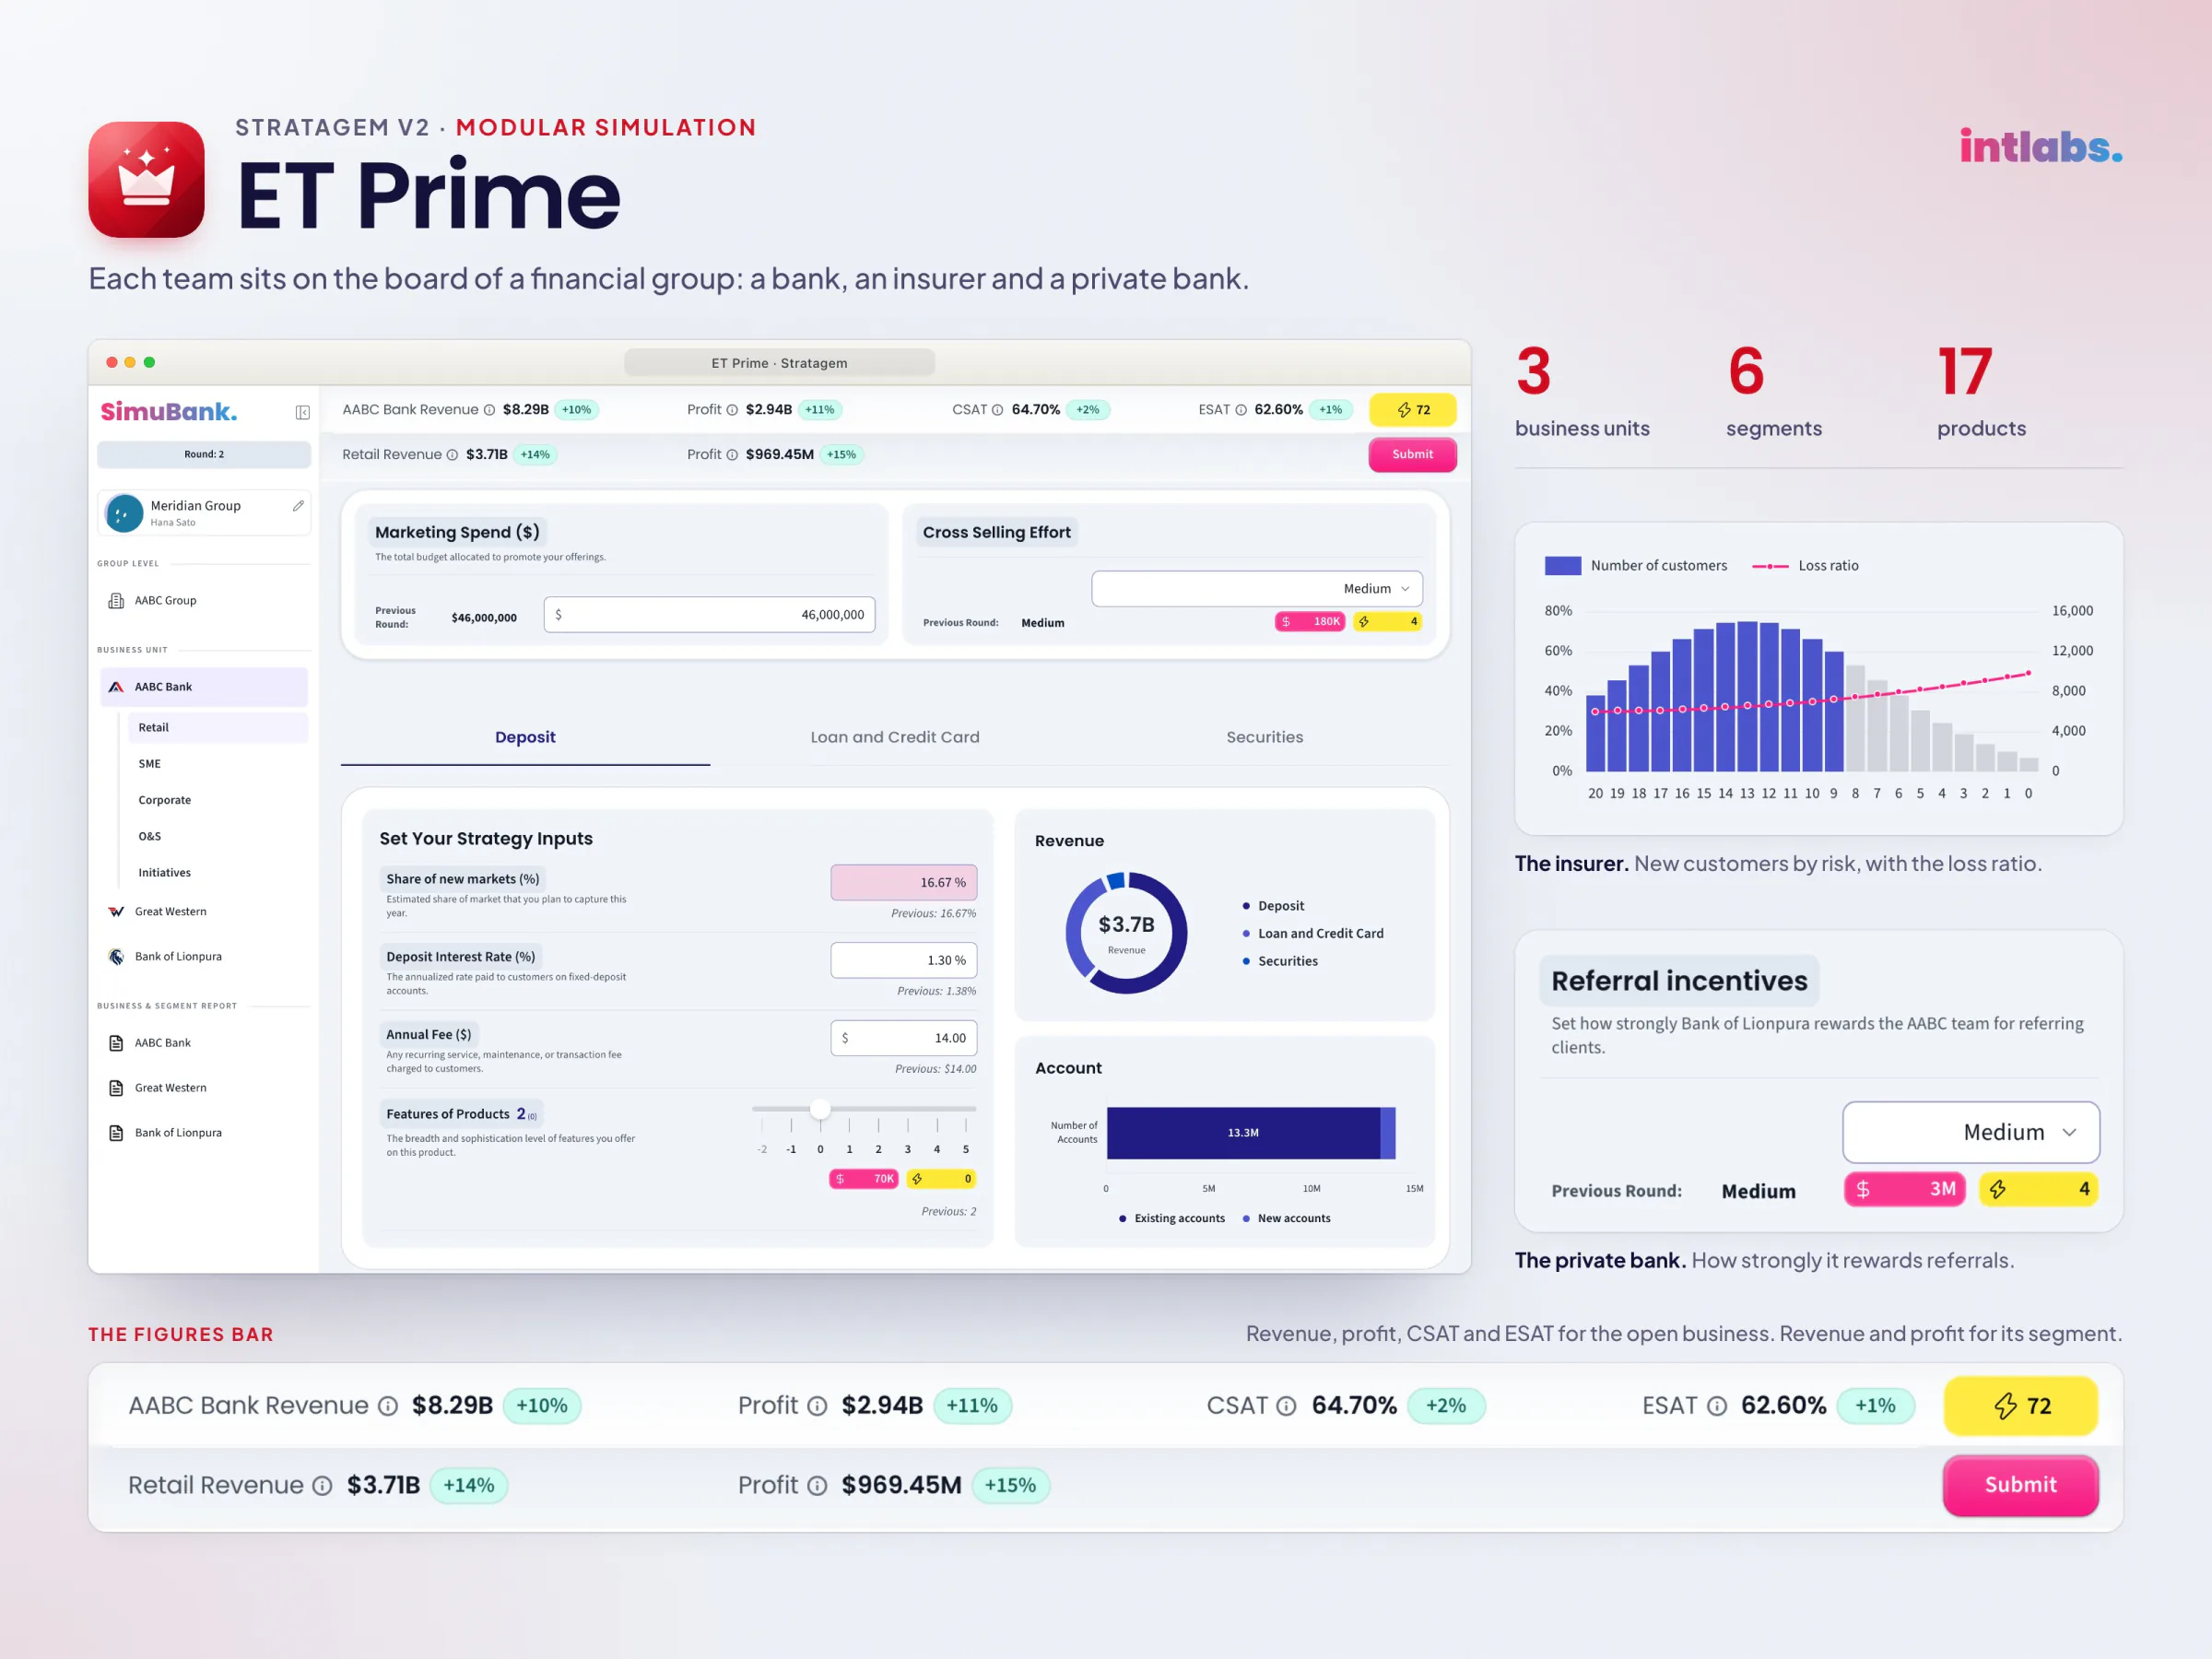
An ET Prime poster: a unit's page in a window, an insurer's risk chart and a figures bar; 3 business units, 6 segments, 17 products.
30ET Prime on one sheet
31 · VideoA team's ET Prime round
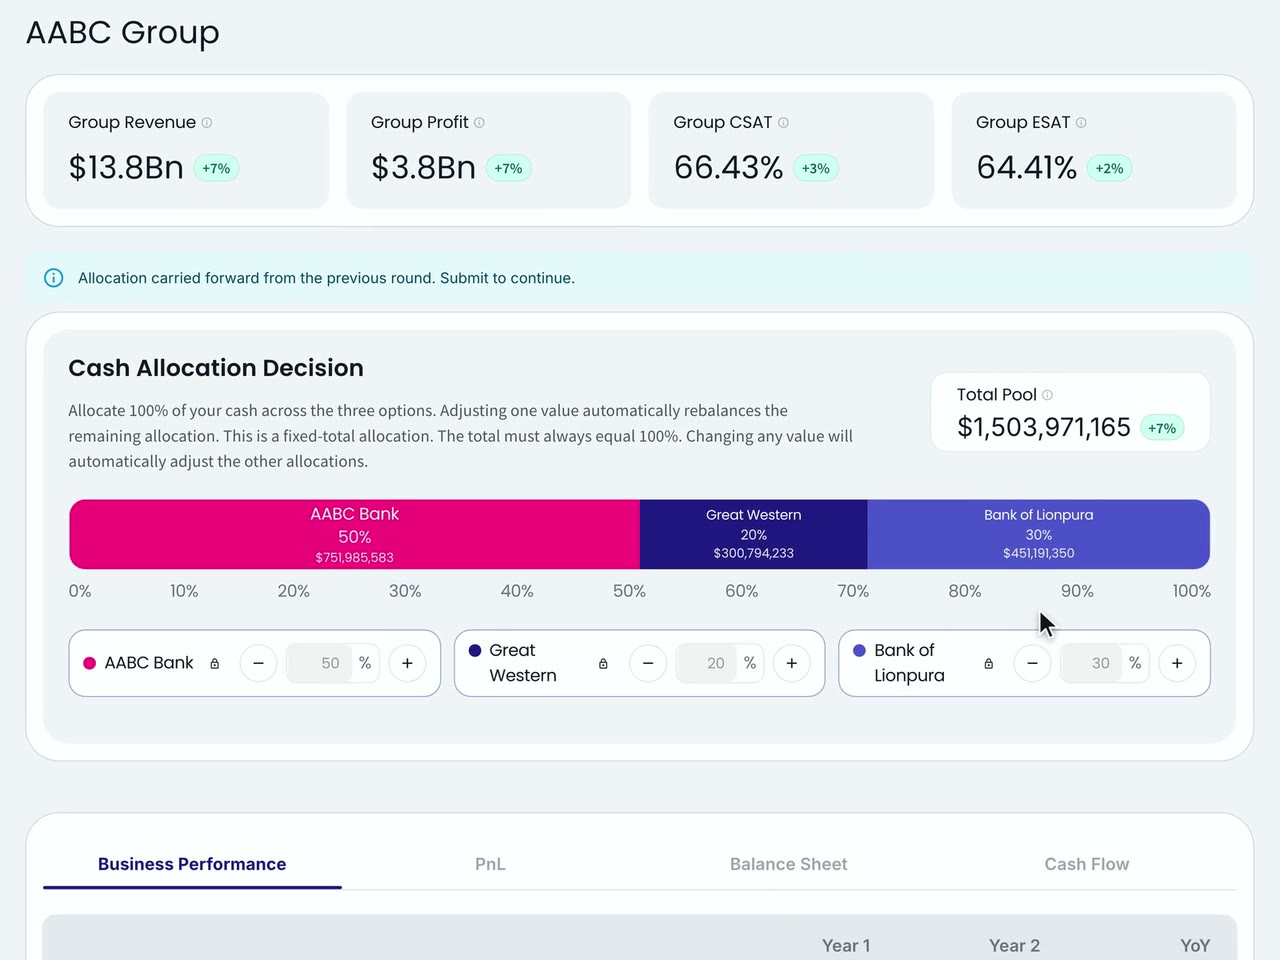
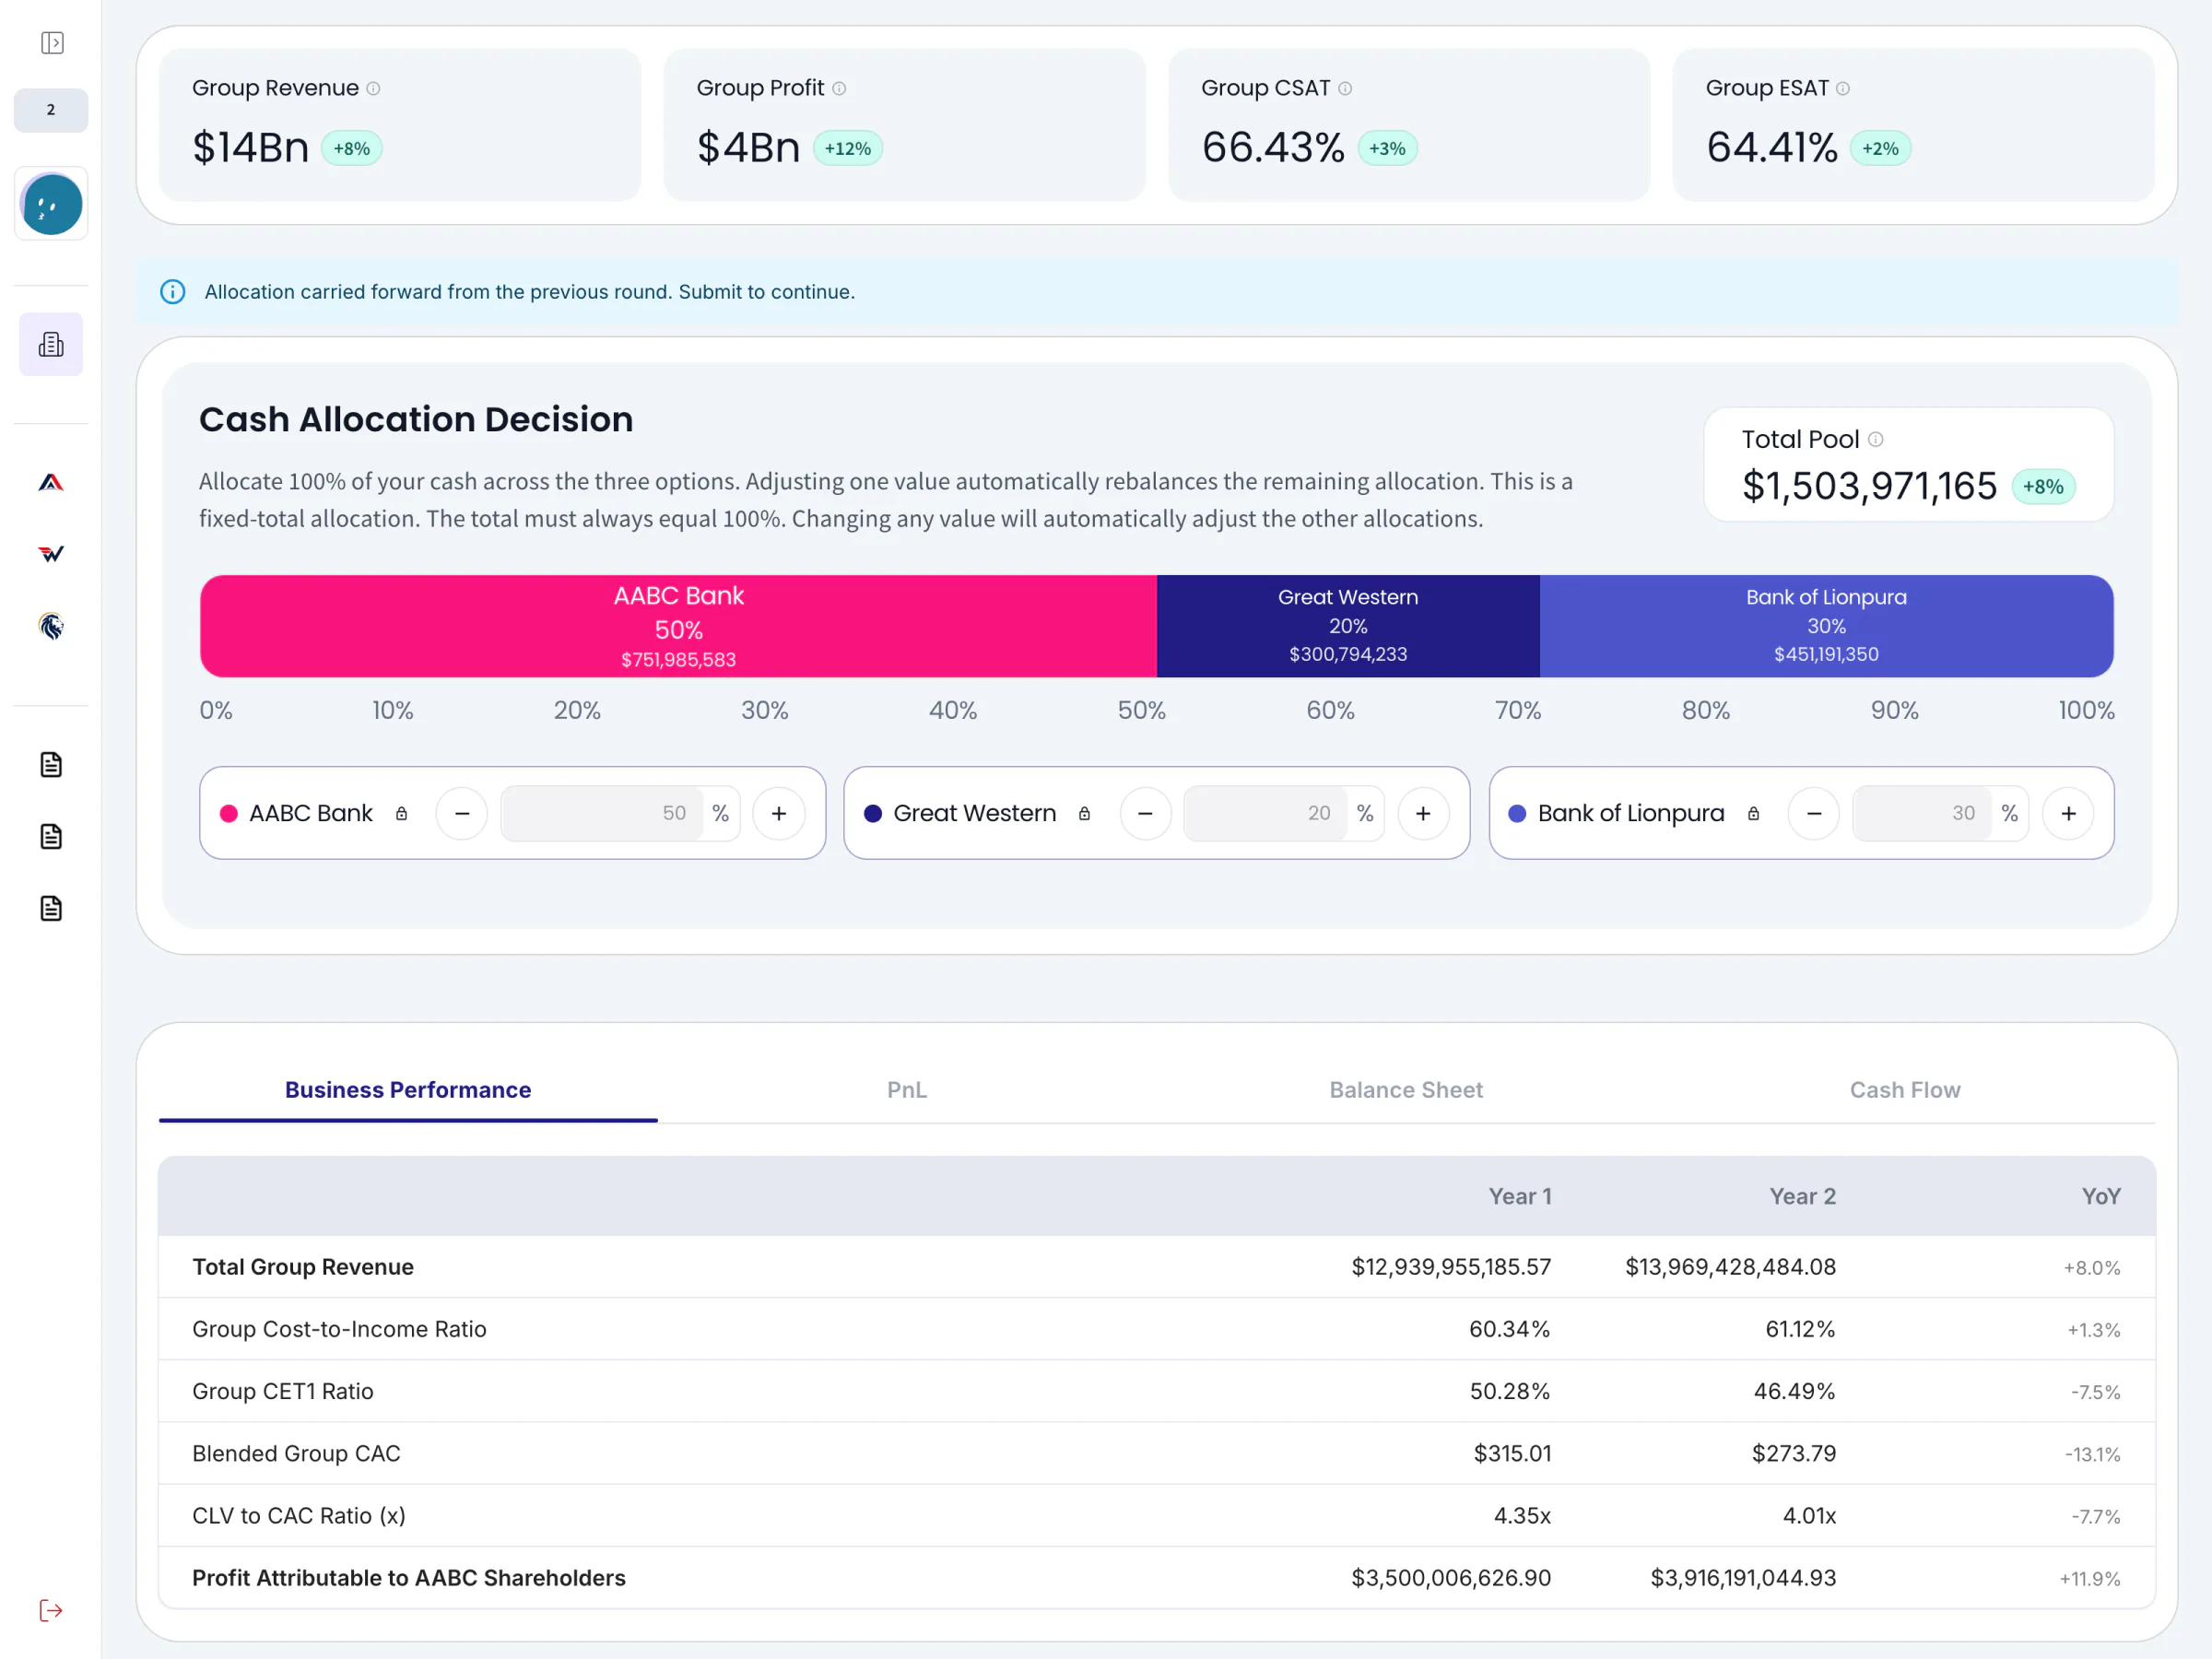
A group page with the sidebar folded: four group figures, a cash split bar of 50, 20 and 30%, and a Business Performance table.
32The group page: one pool of cash, split across three units
A bank unit's Retail page: Marketing Spend and Cross Selling Effort tiles, three product tabs, deposit inputs and a revenue donut.
33The commercial bank
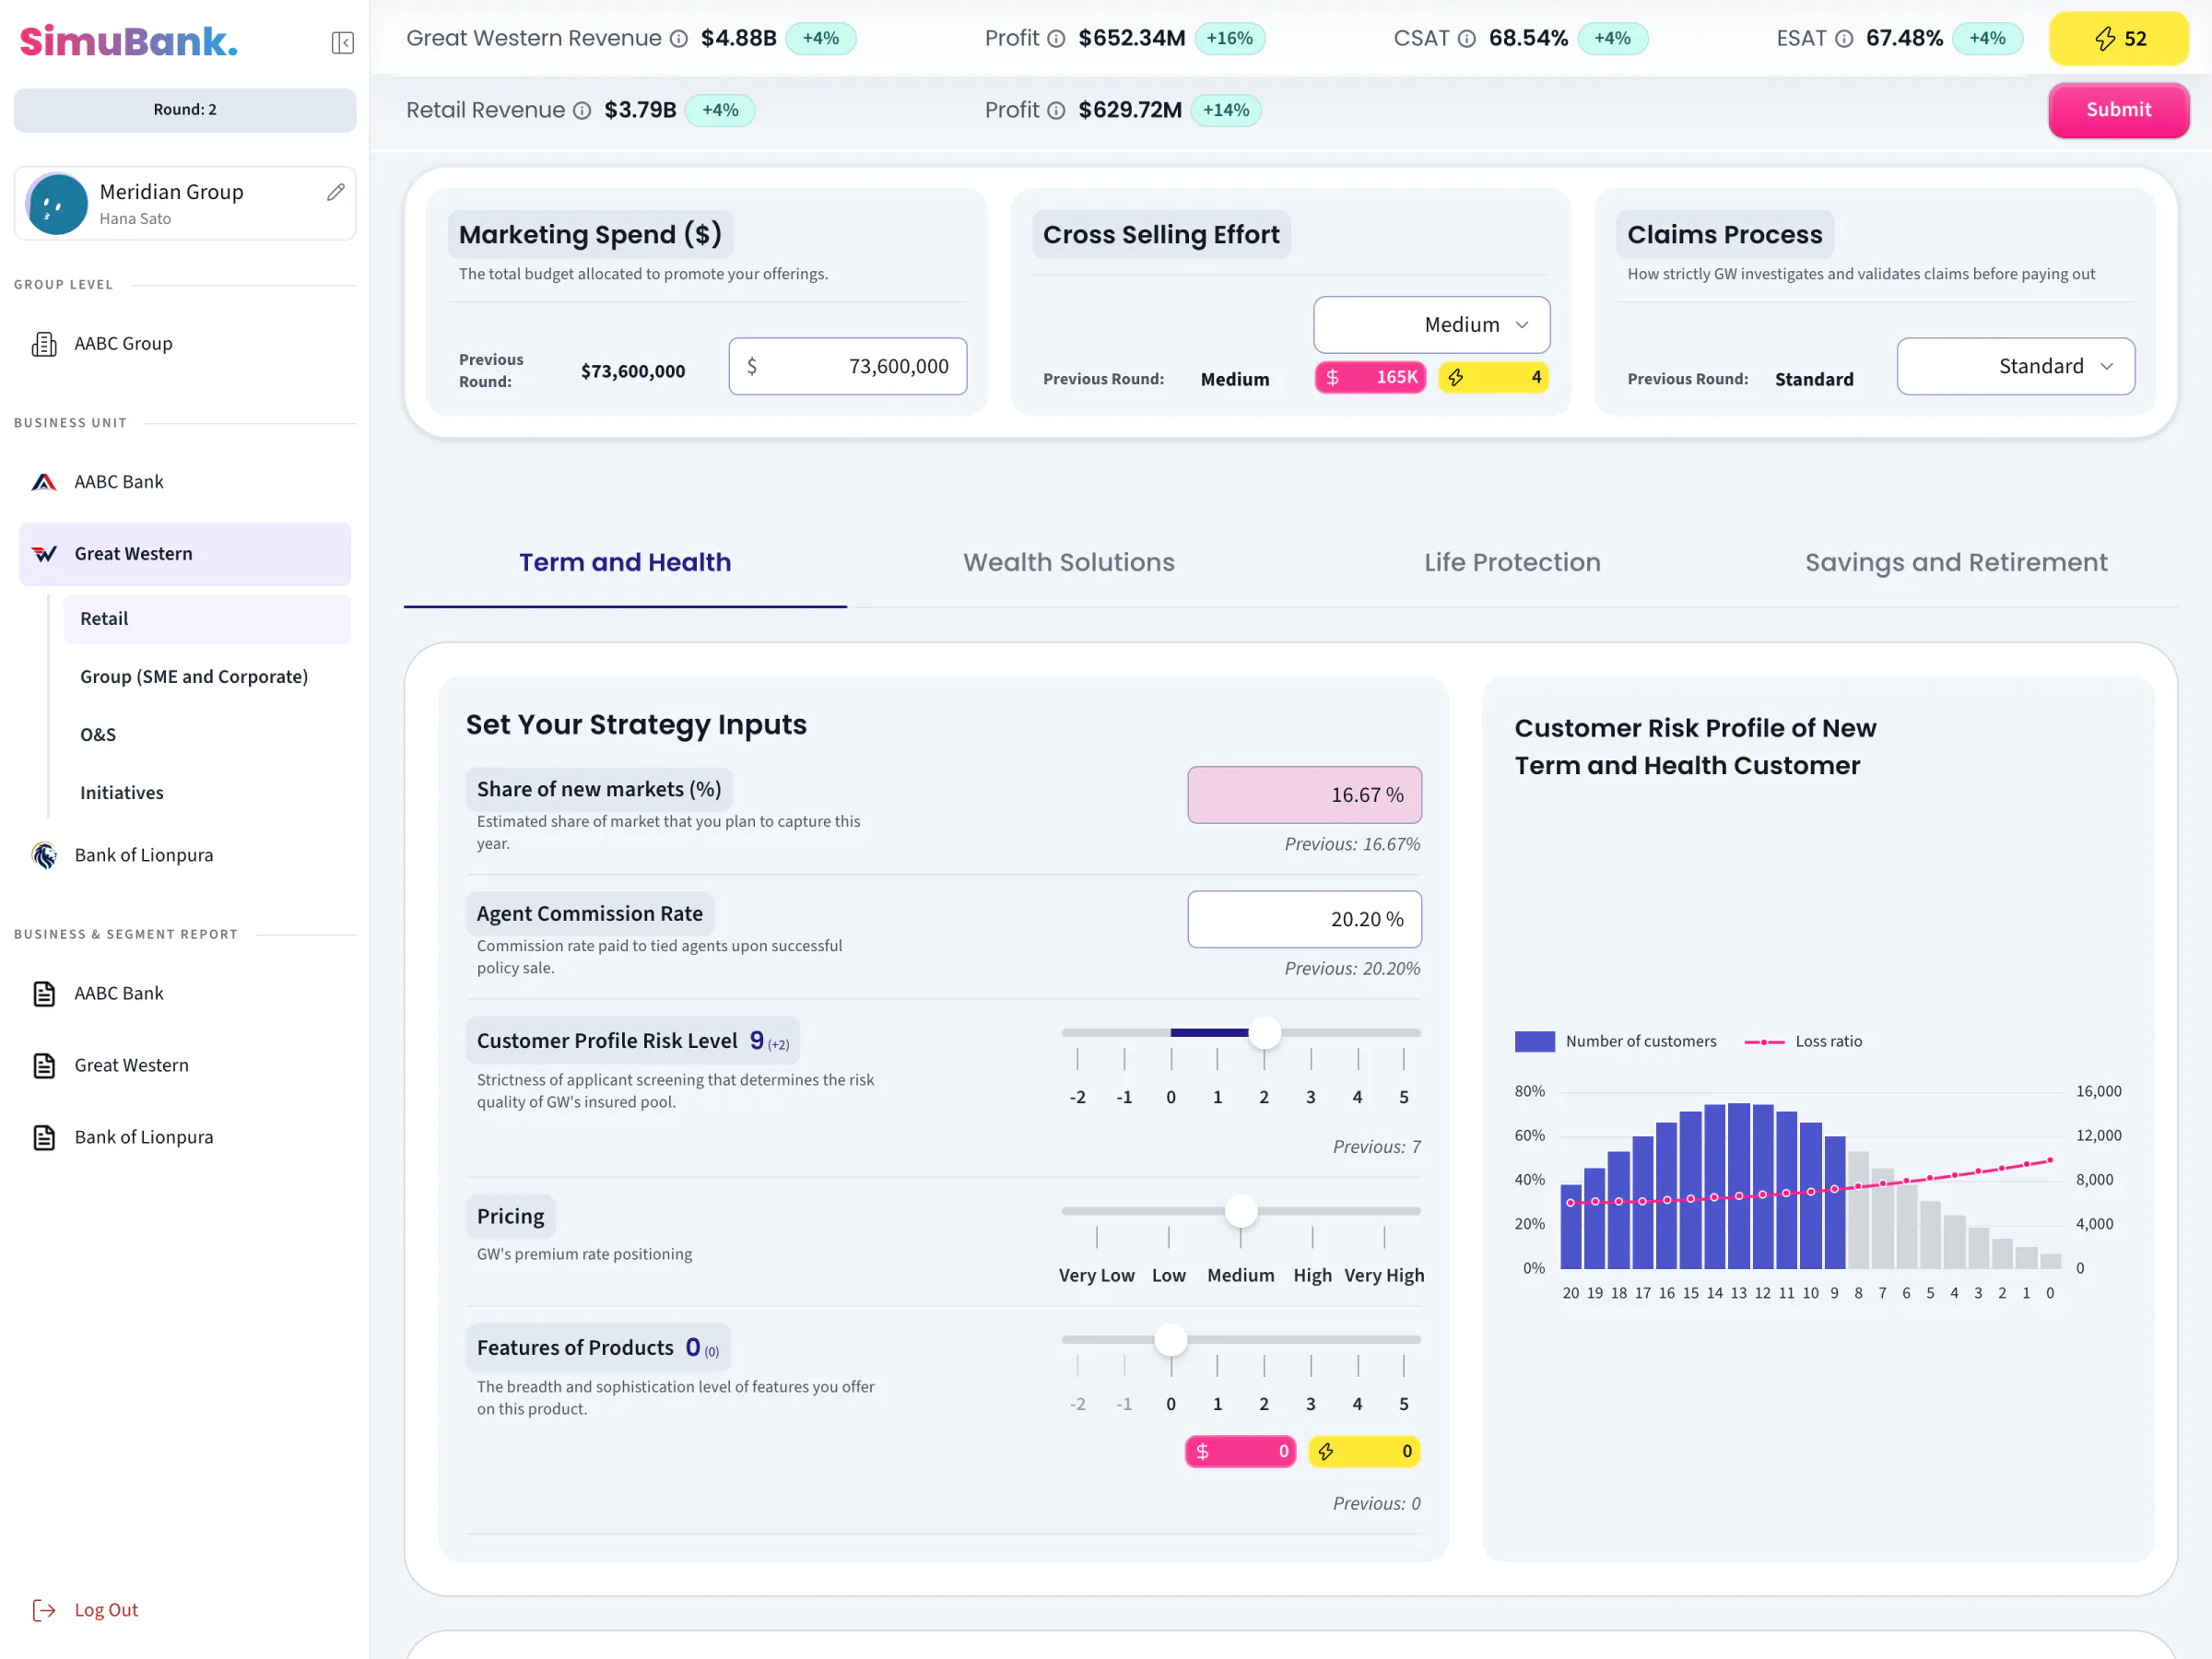
An insurer's Retail page on the Term and Health tab: inputs with a risk level slider, beside a customer risk profile chart.
34The insurer
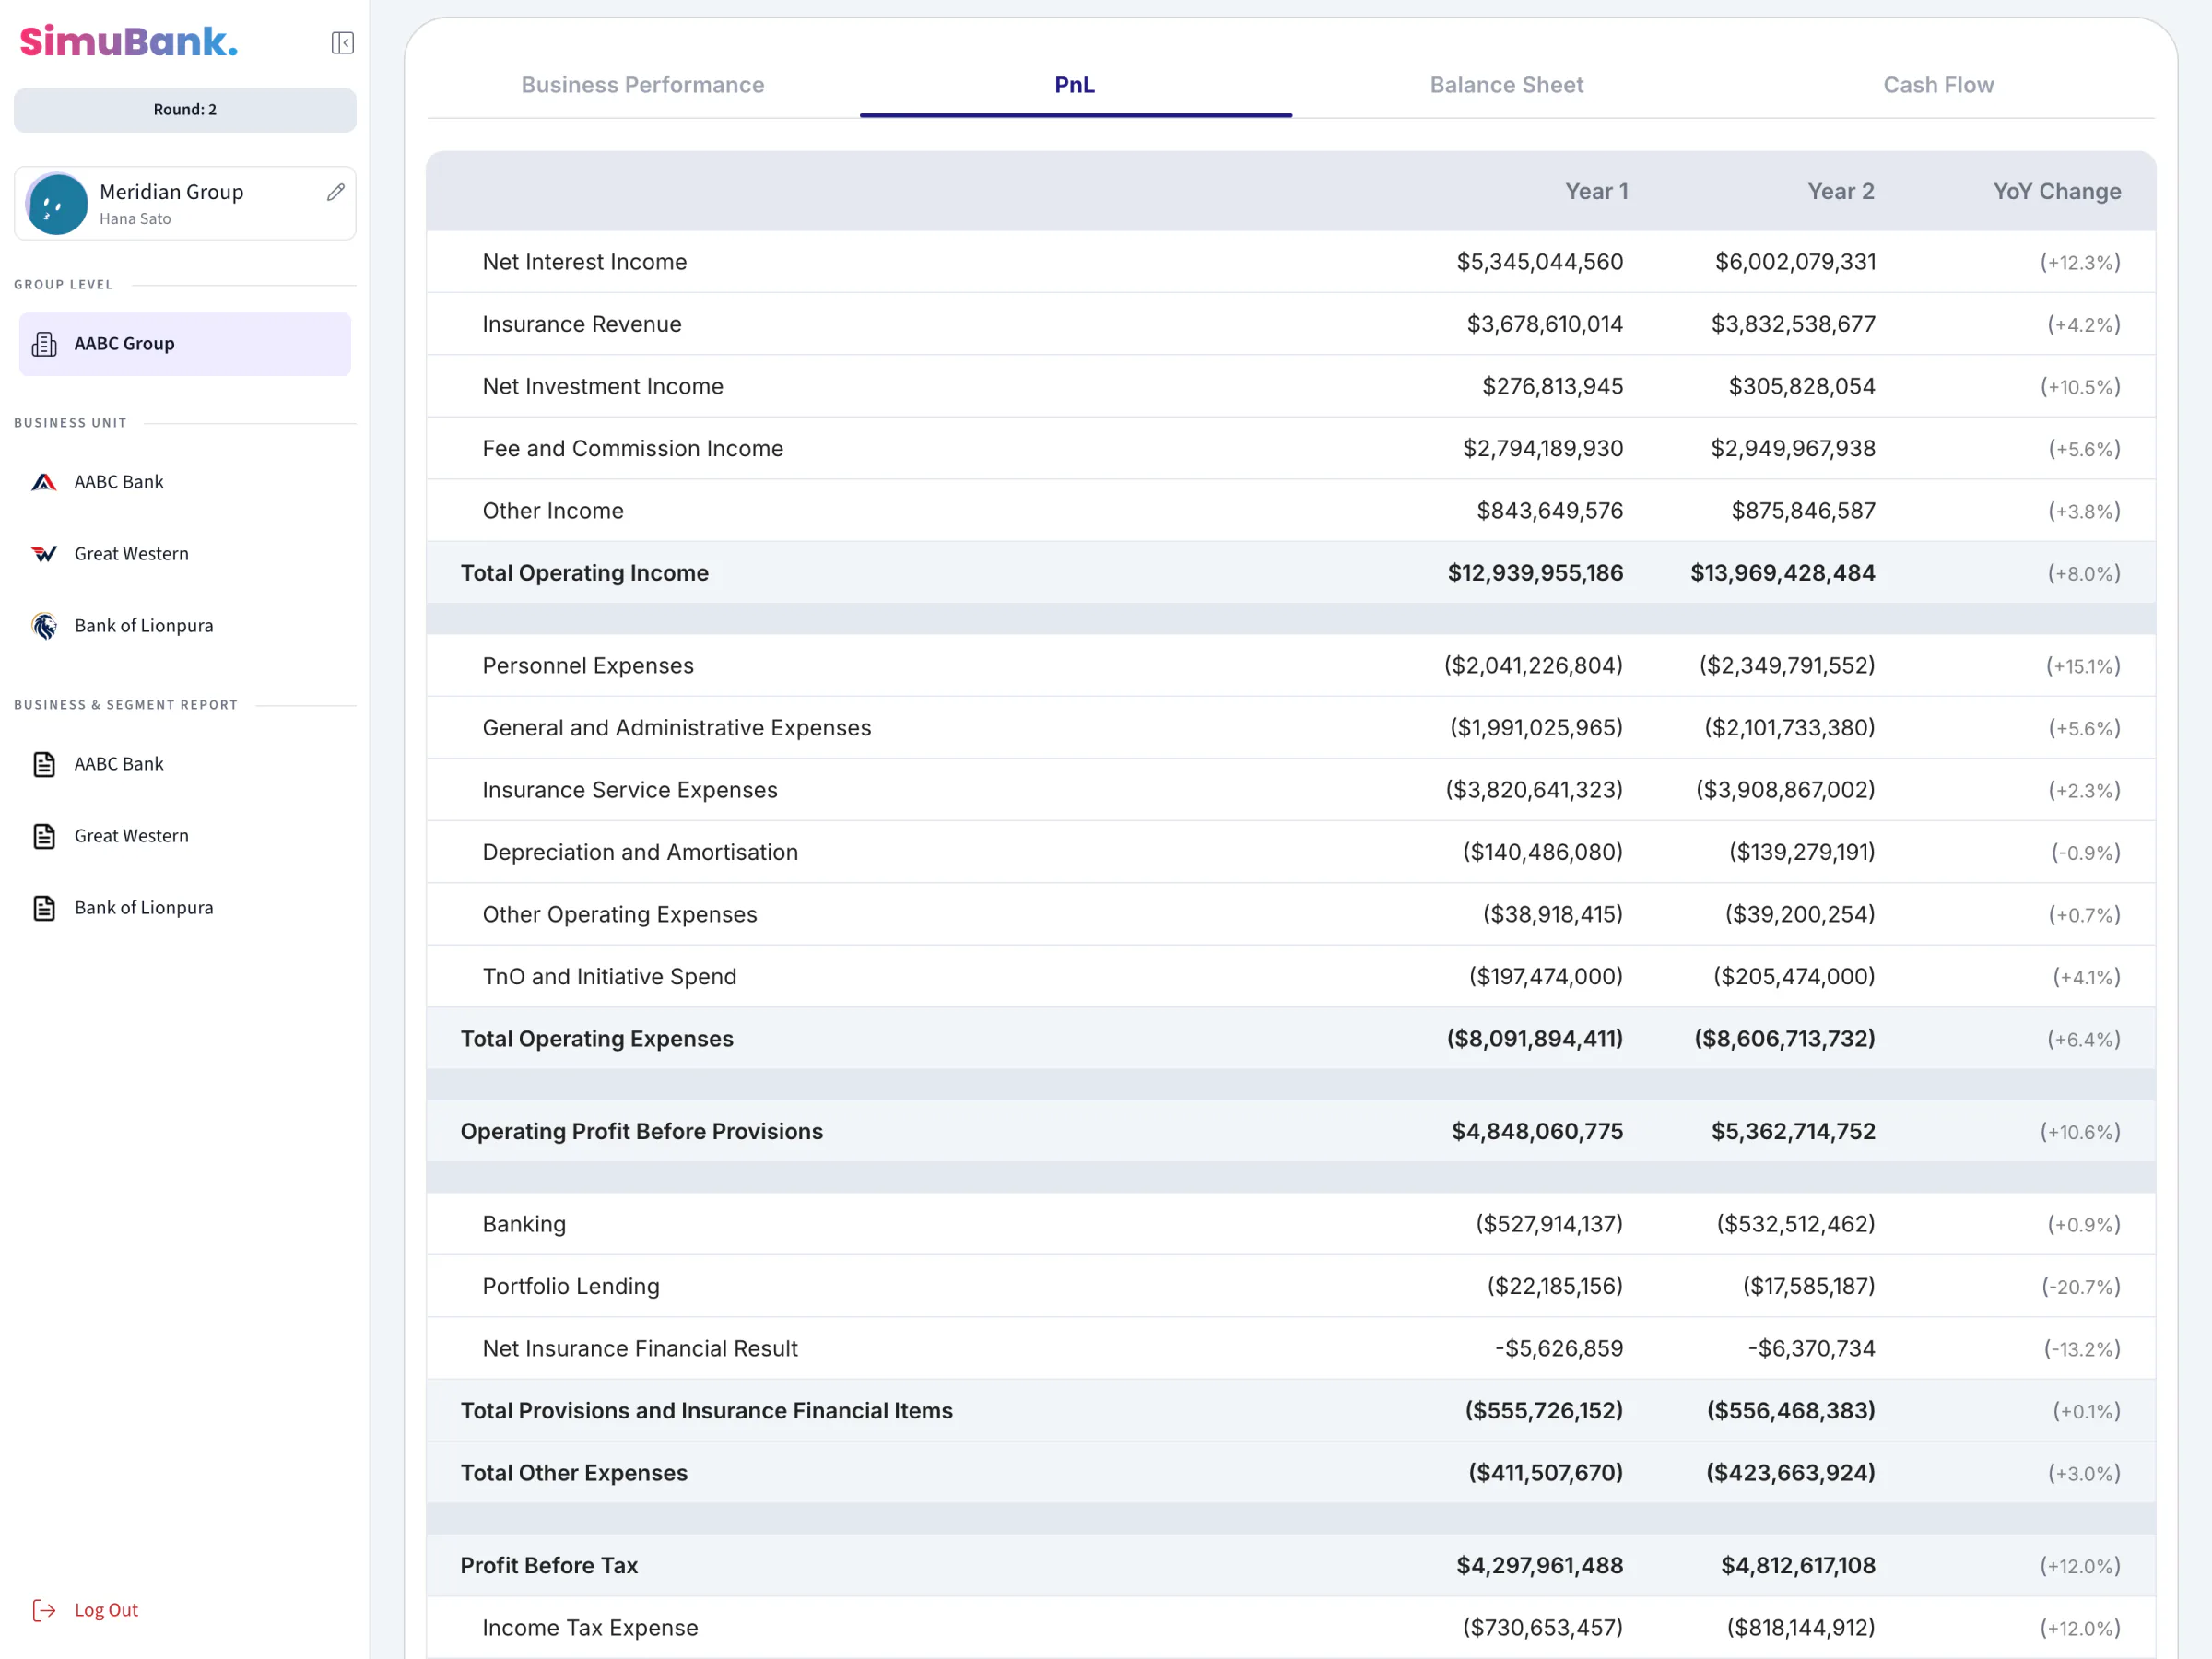
The group's PnL: rows from net interest income to profit before tax, for Year 1, Year 2 and the change.
35The group's statements are built from the three units
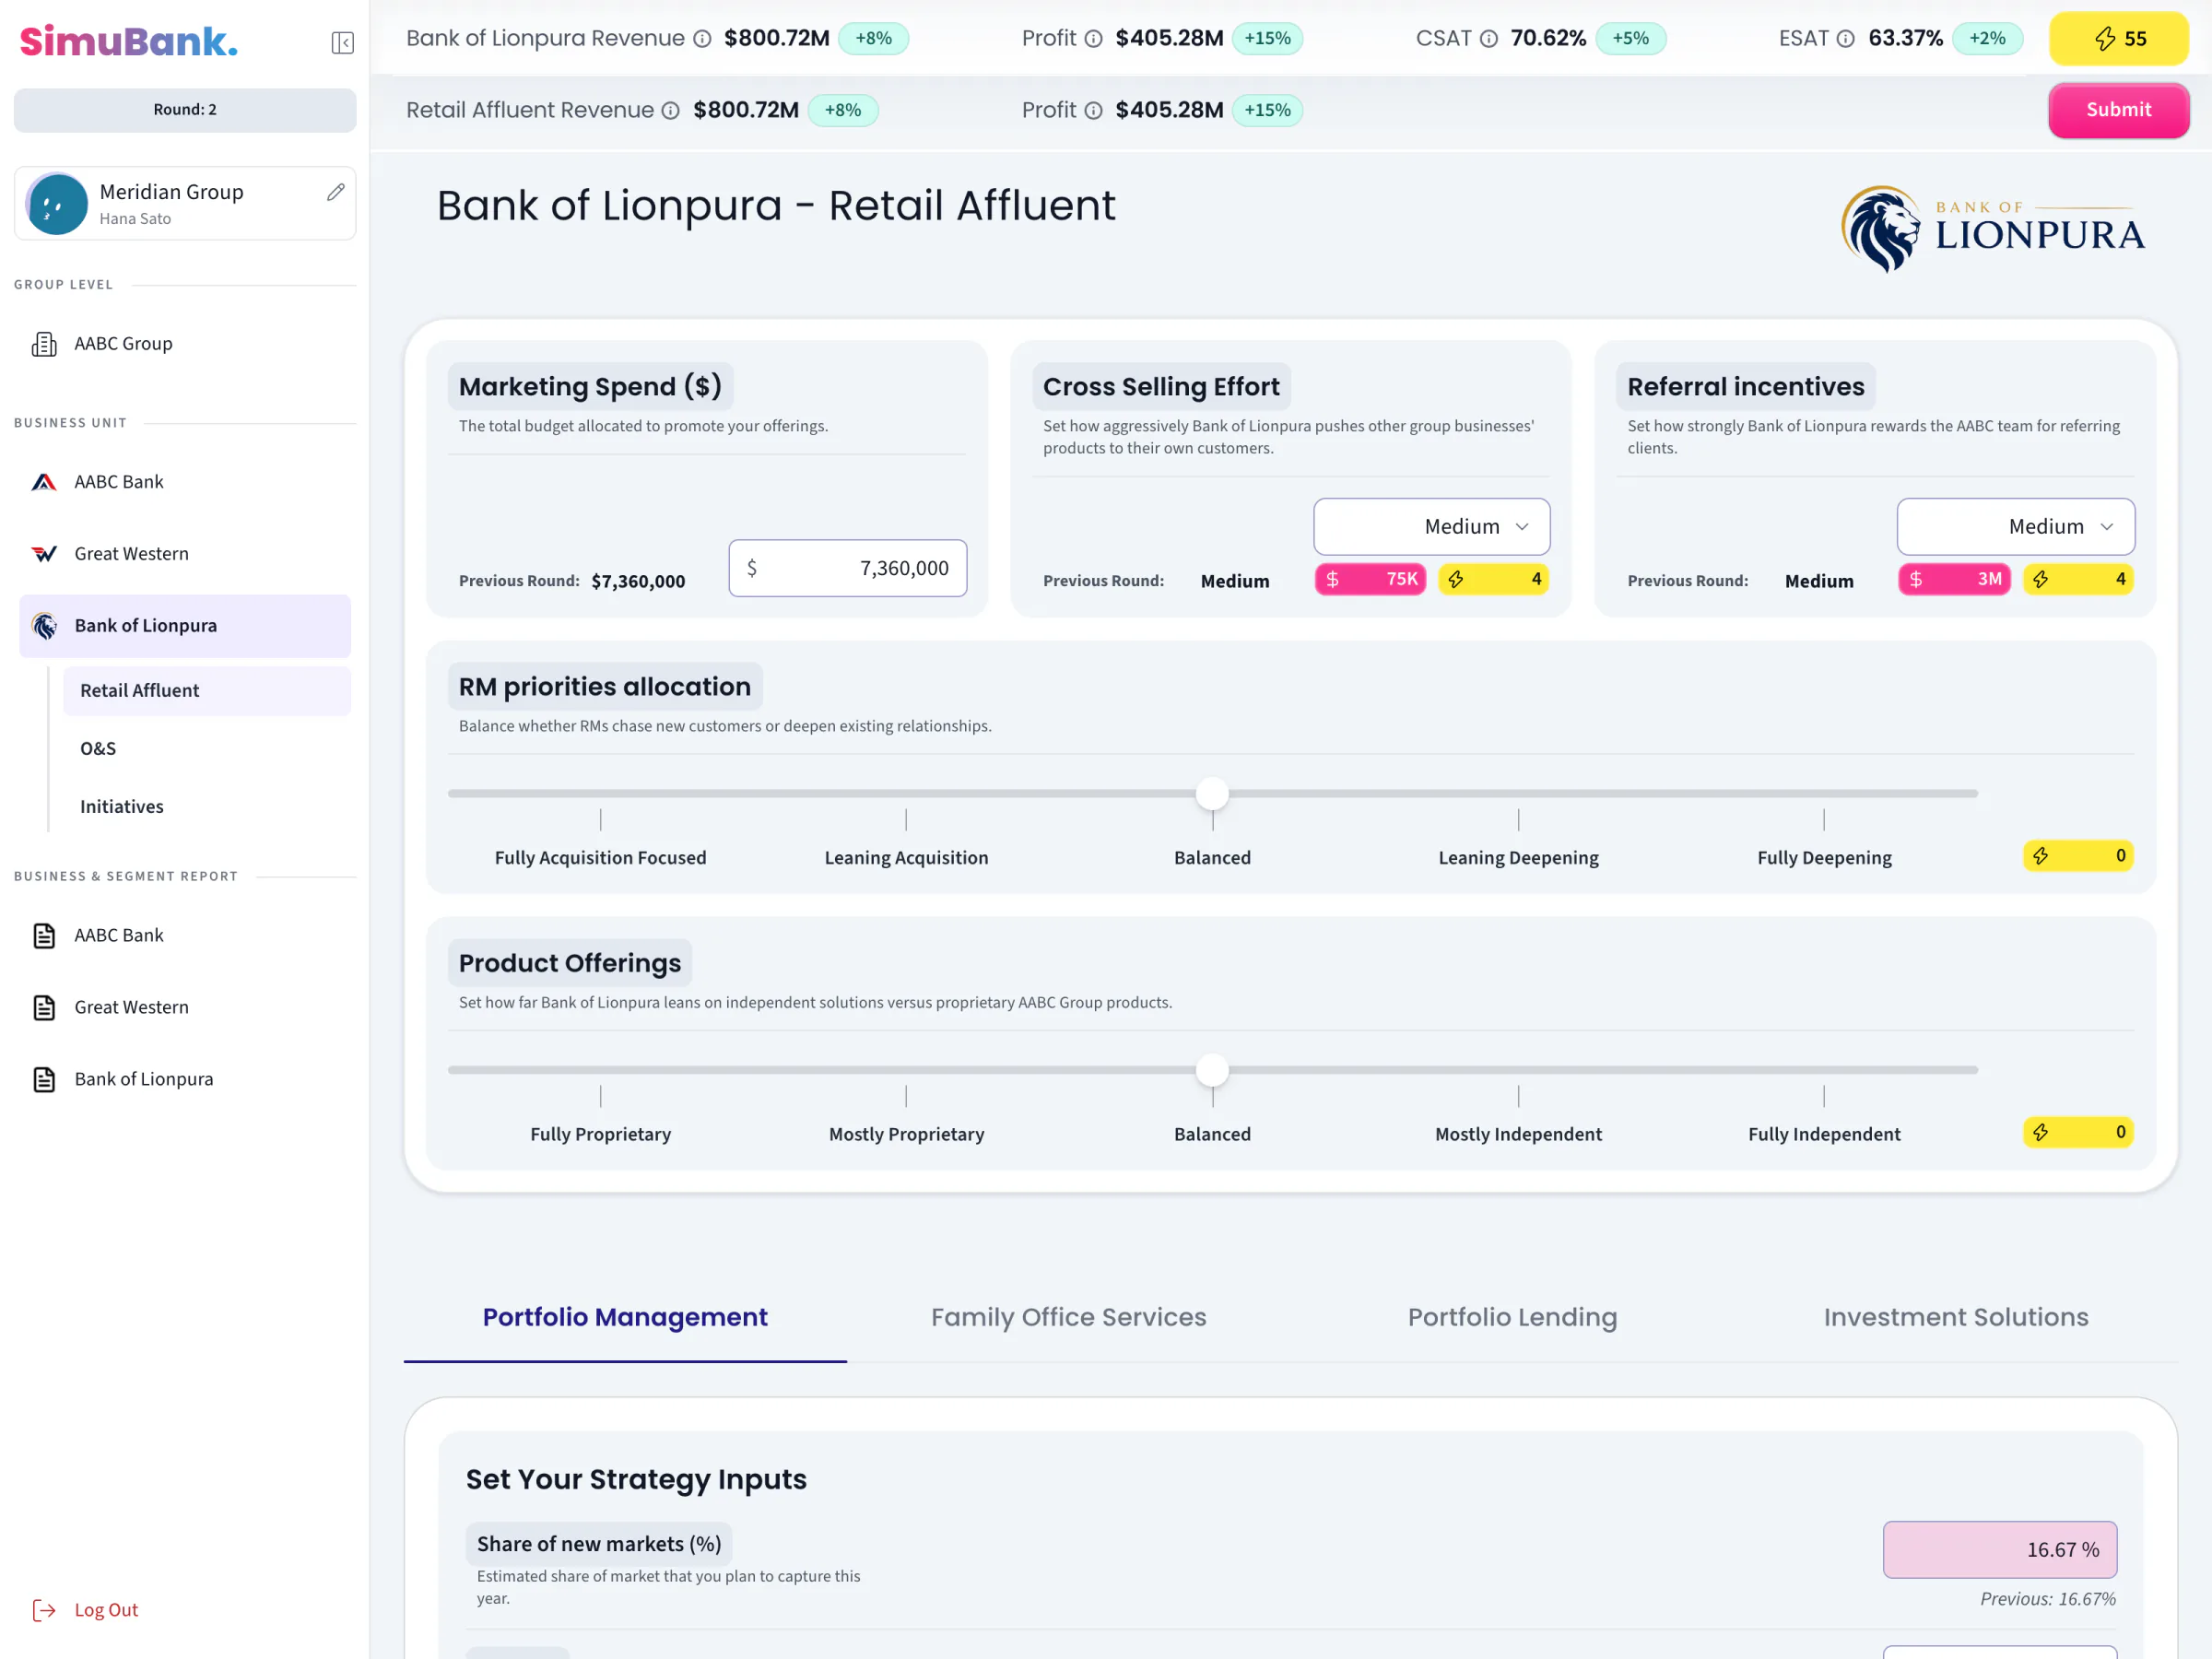
A private bank's page with its lion logo: five tiles, two of them word sliders, above four product tabs.
36The private bank
05

Product: Run a Consumer-Goods Company

The team leads Lumina, a fictional household-cleaning company with three brands. It starts with one product on sale and opens the rest through research and development. For each product it sets price, promotion, marketing and a share forecast, channel by channel, across Modern, Traditional and Online. The forecast sets production, and a team sells the smaller of what it produced and what was demanded, so over-forecasting leaves unsold stock. Each year closes with full statements, carbon cost included. Product's player is still on MUI: it moves to the design system after Banking and ET Prime.

  • 3 brands, 6 products, 3 sales channels, and 78 inputs once everything is unlocked.
  • Energy is enforced here: 100 points in round 1 and 110 after.
  • "Product" on screen and "FMCG" in the data, so no number moves.
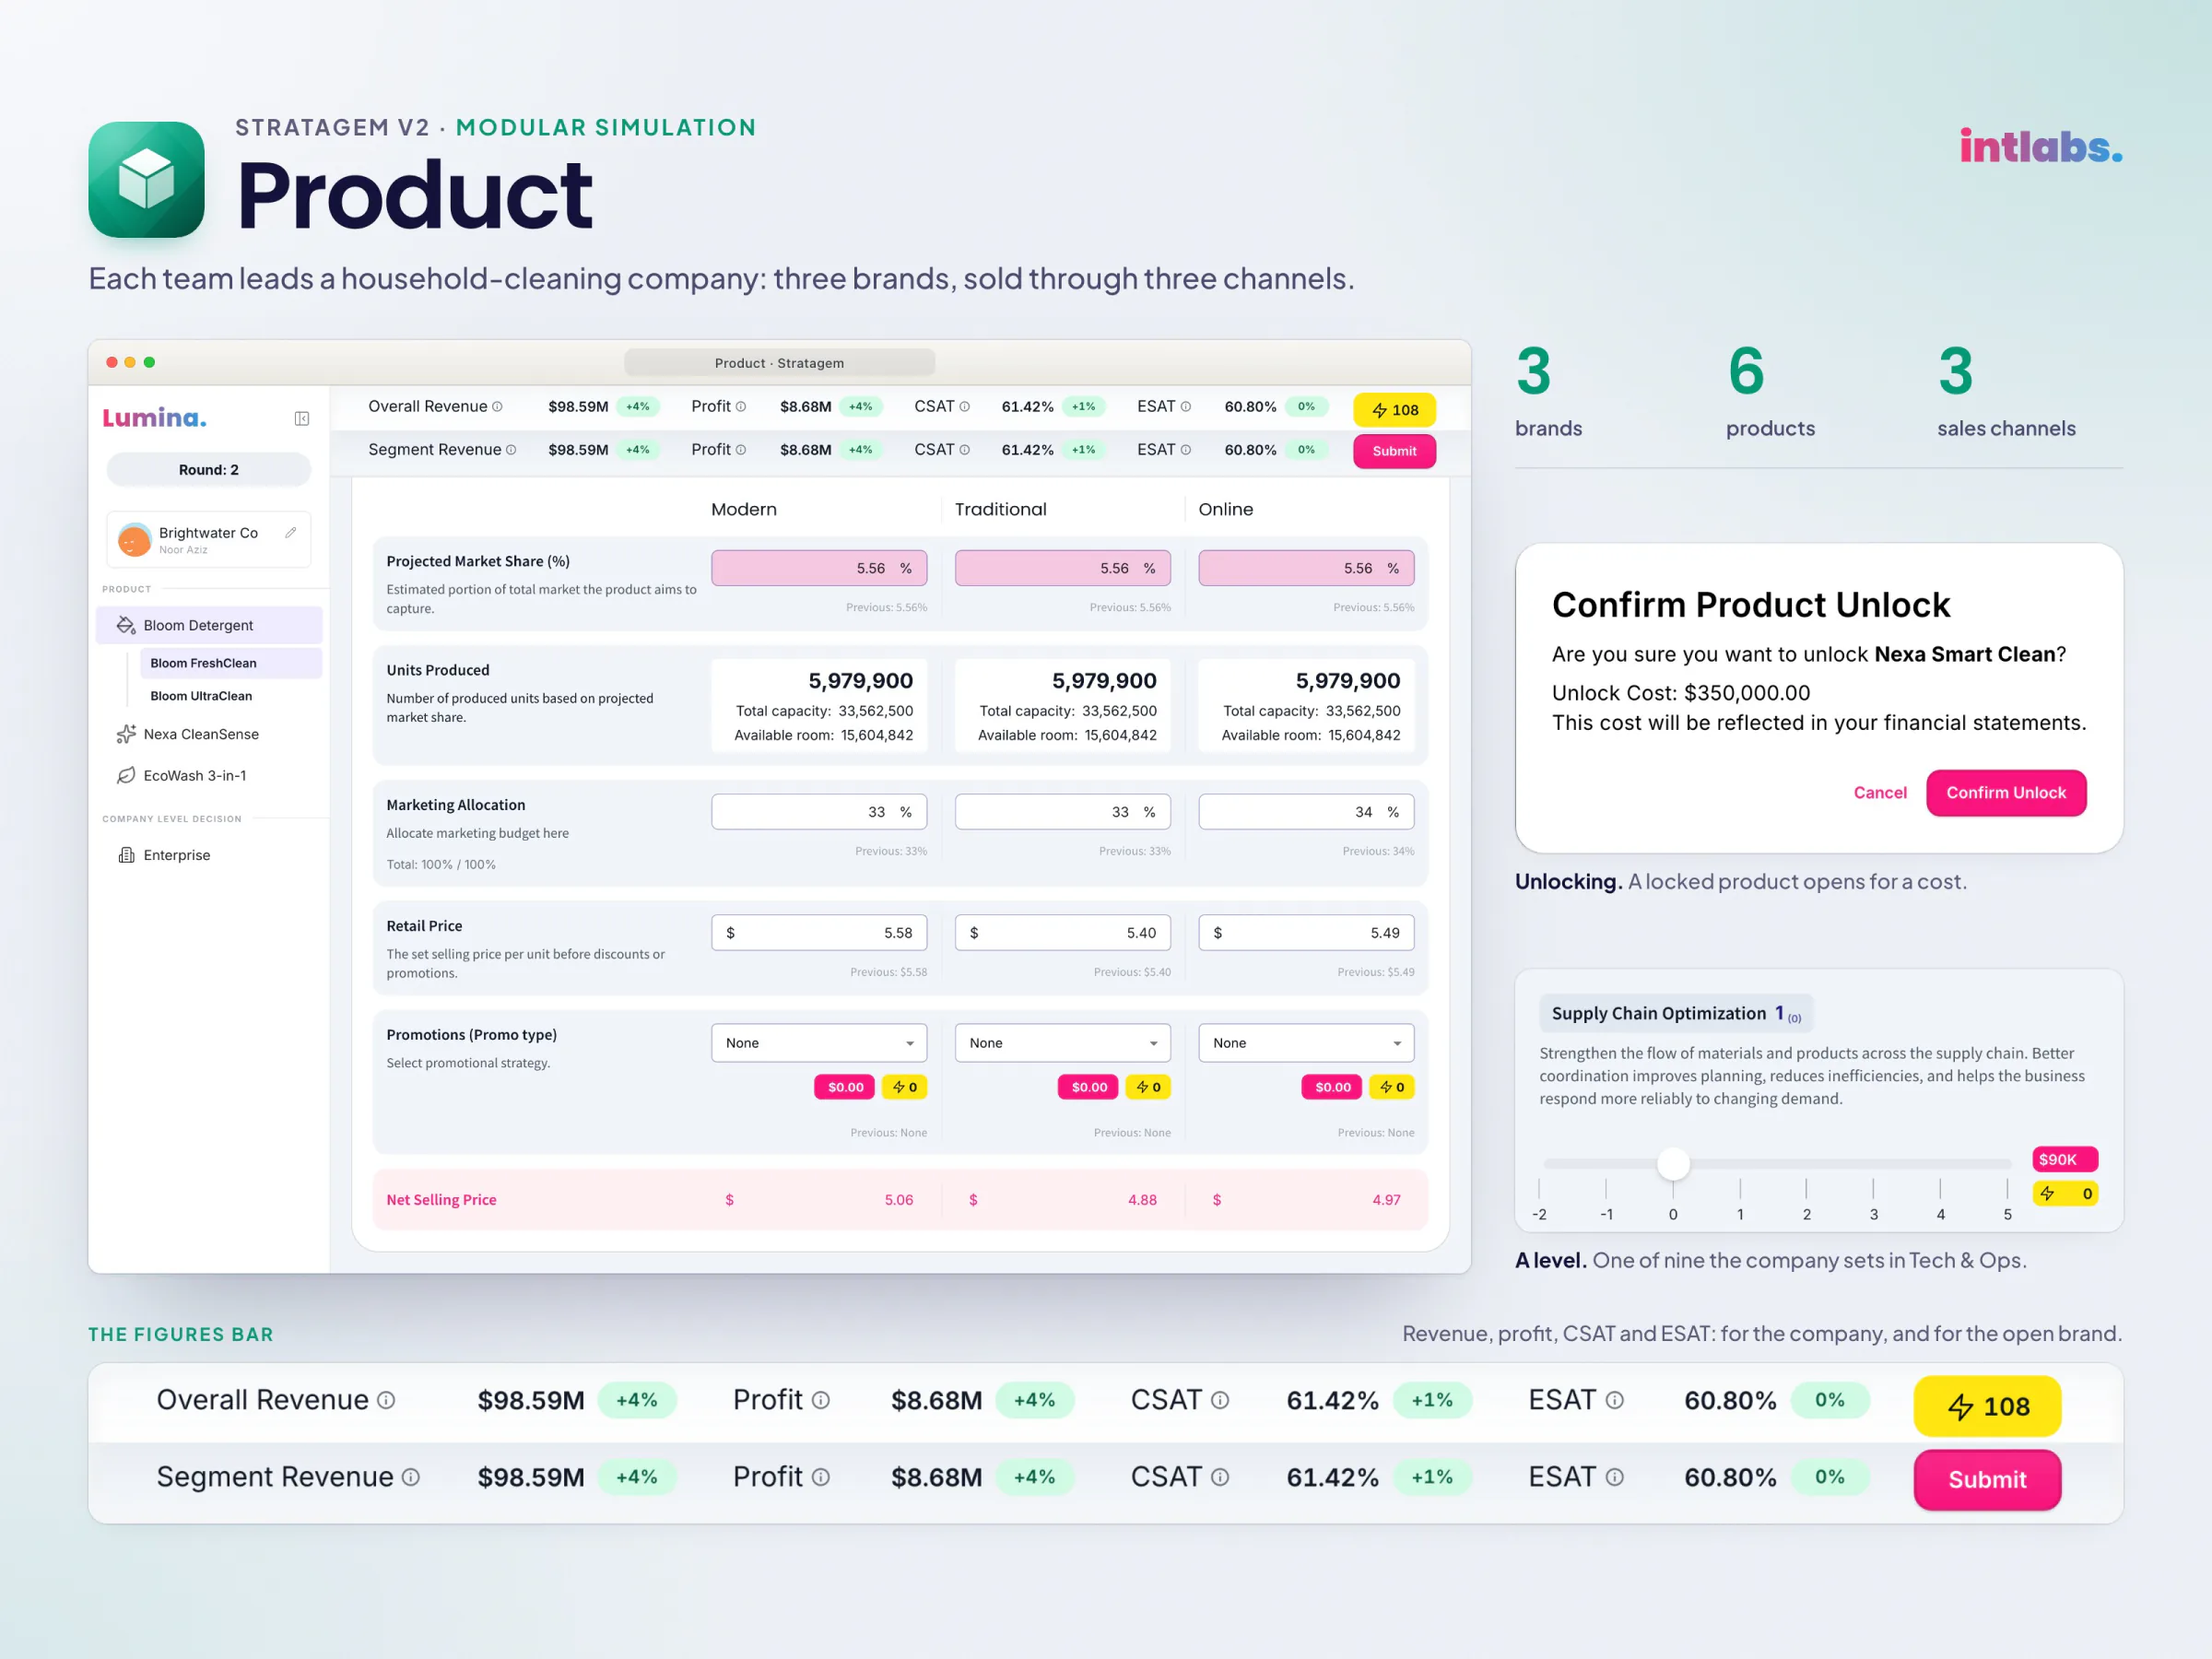
A Product poster: a product page in a window, an unlock dialog for $350,000.00 and a figures bar; 3 brands, 6 products, 3 sales channels.
37Product on one sheet
38 · VideoA team's Product round
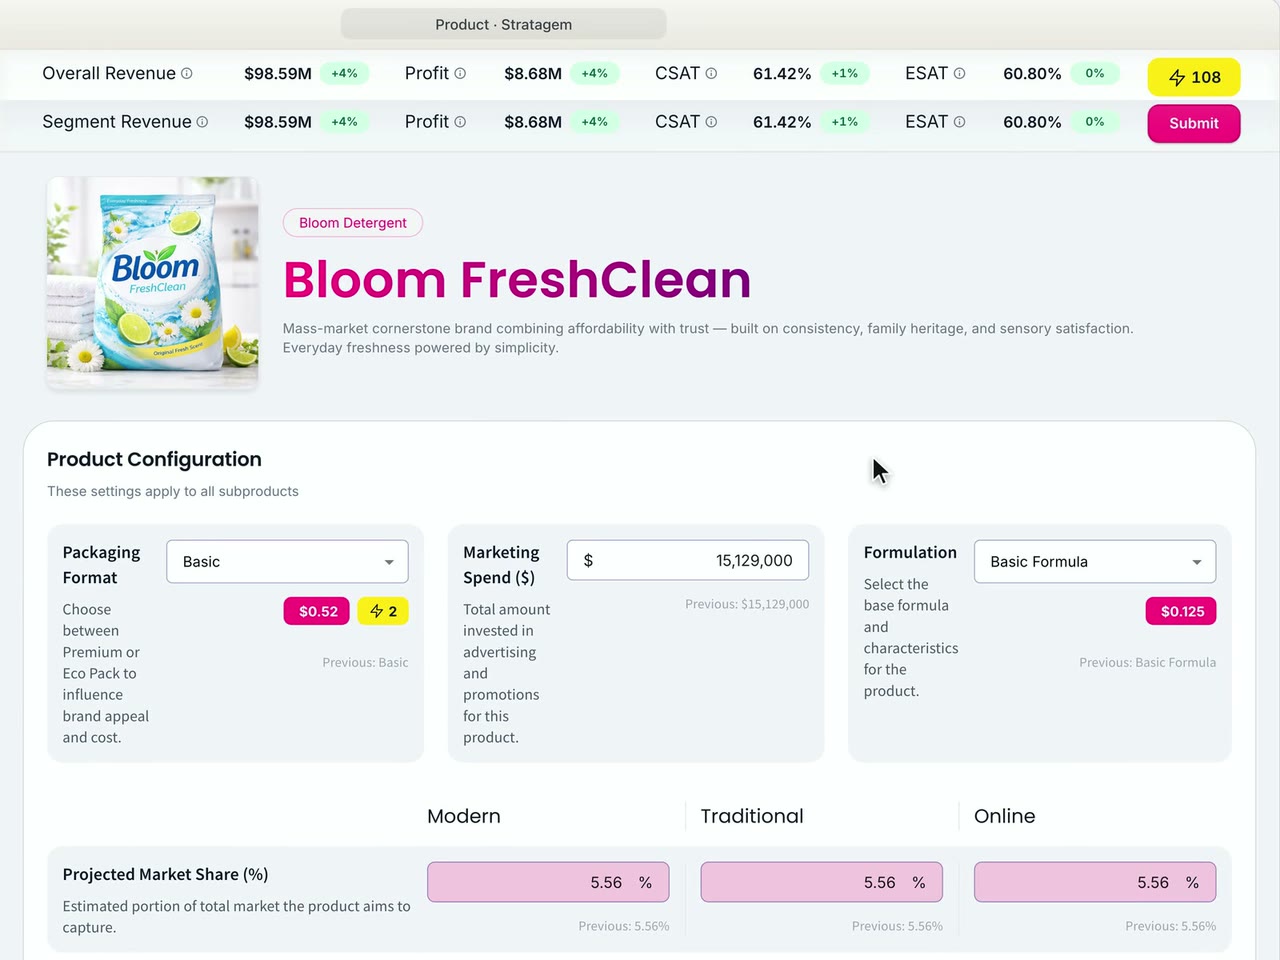
A product page: a pack shot of Bloom FreshClean, three product choices and a channel table, under figures showing $98.59M revenue.
39A product page
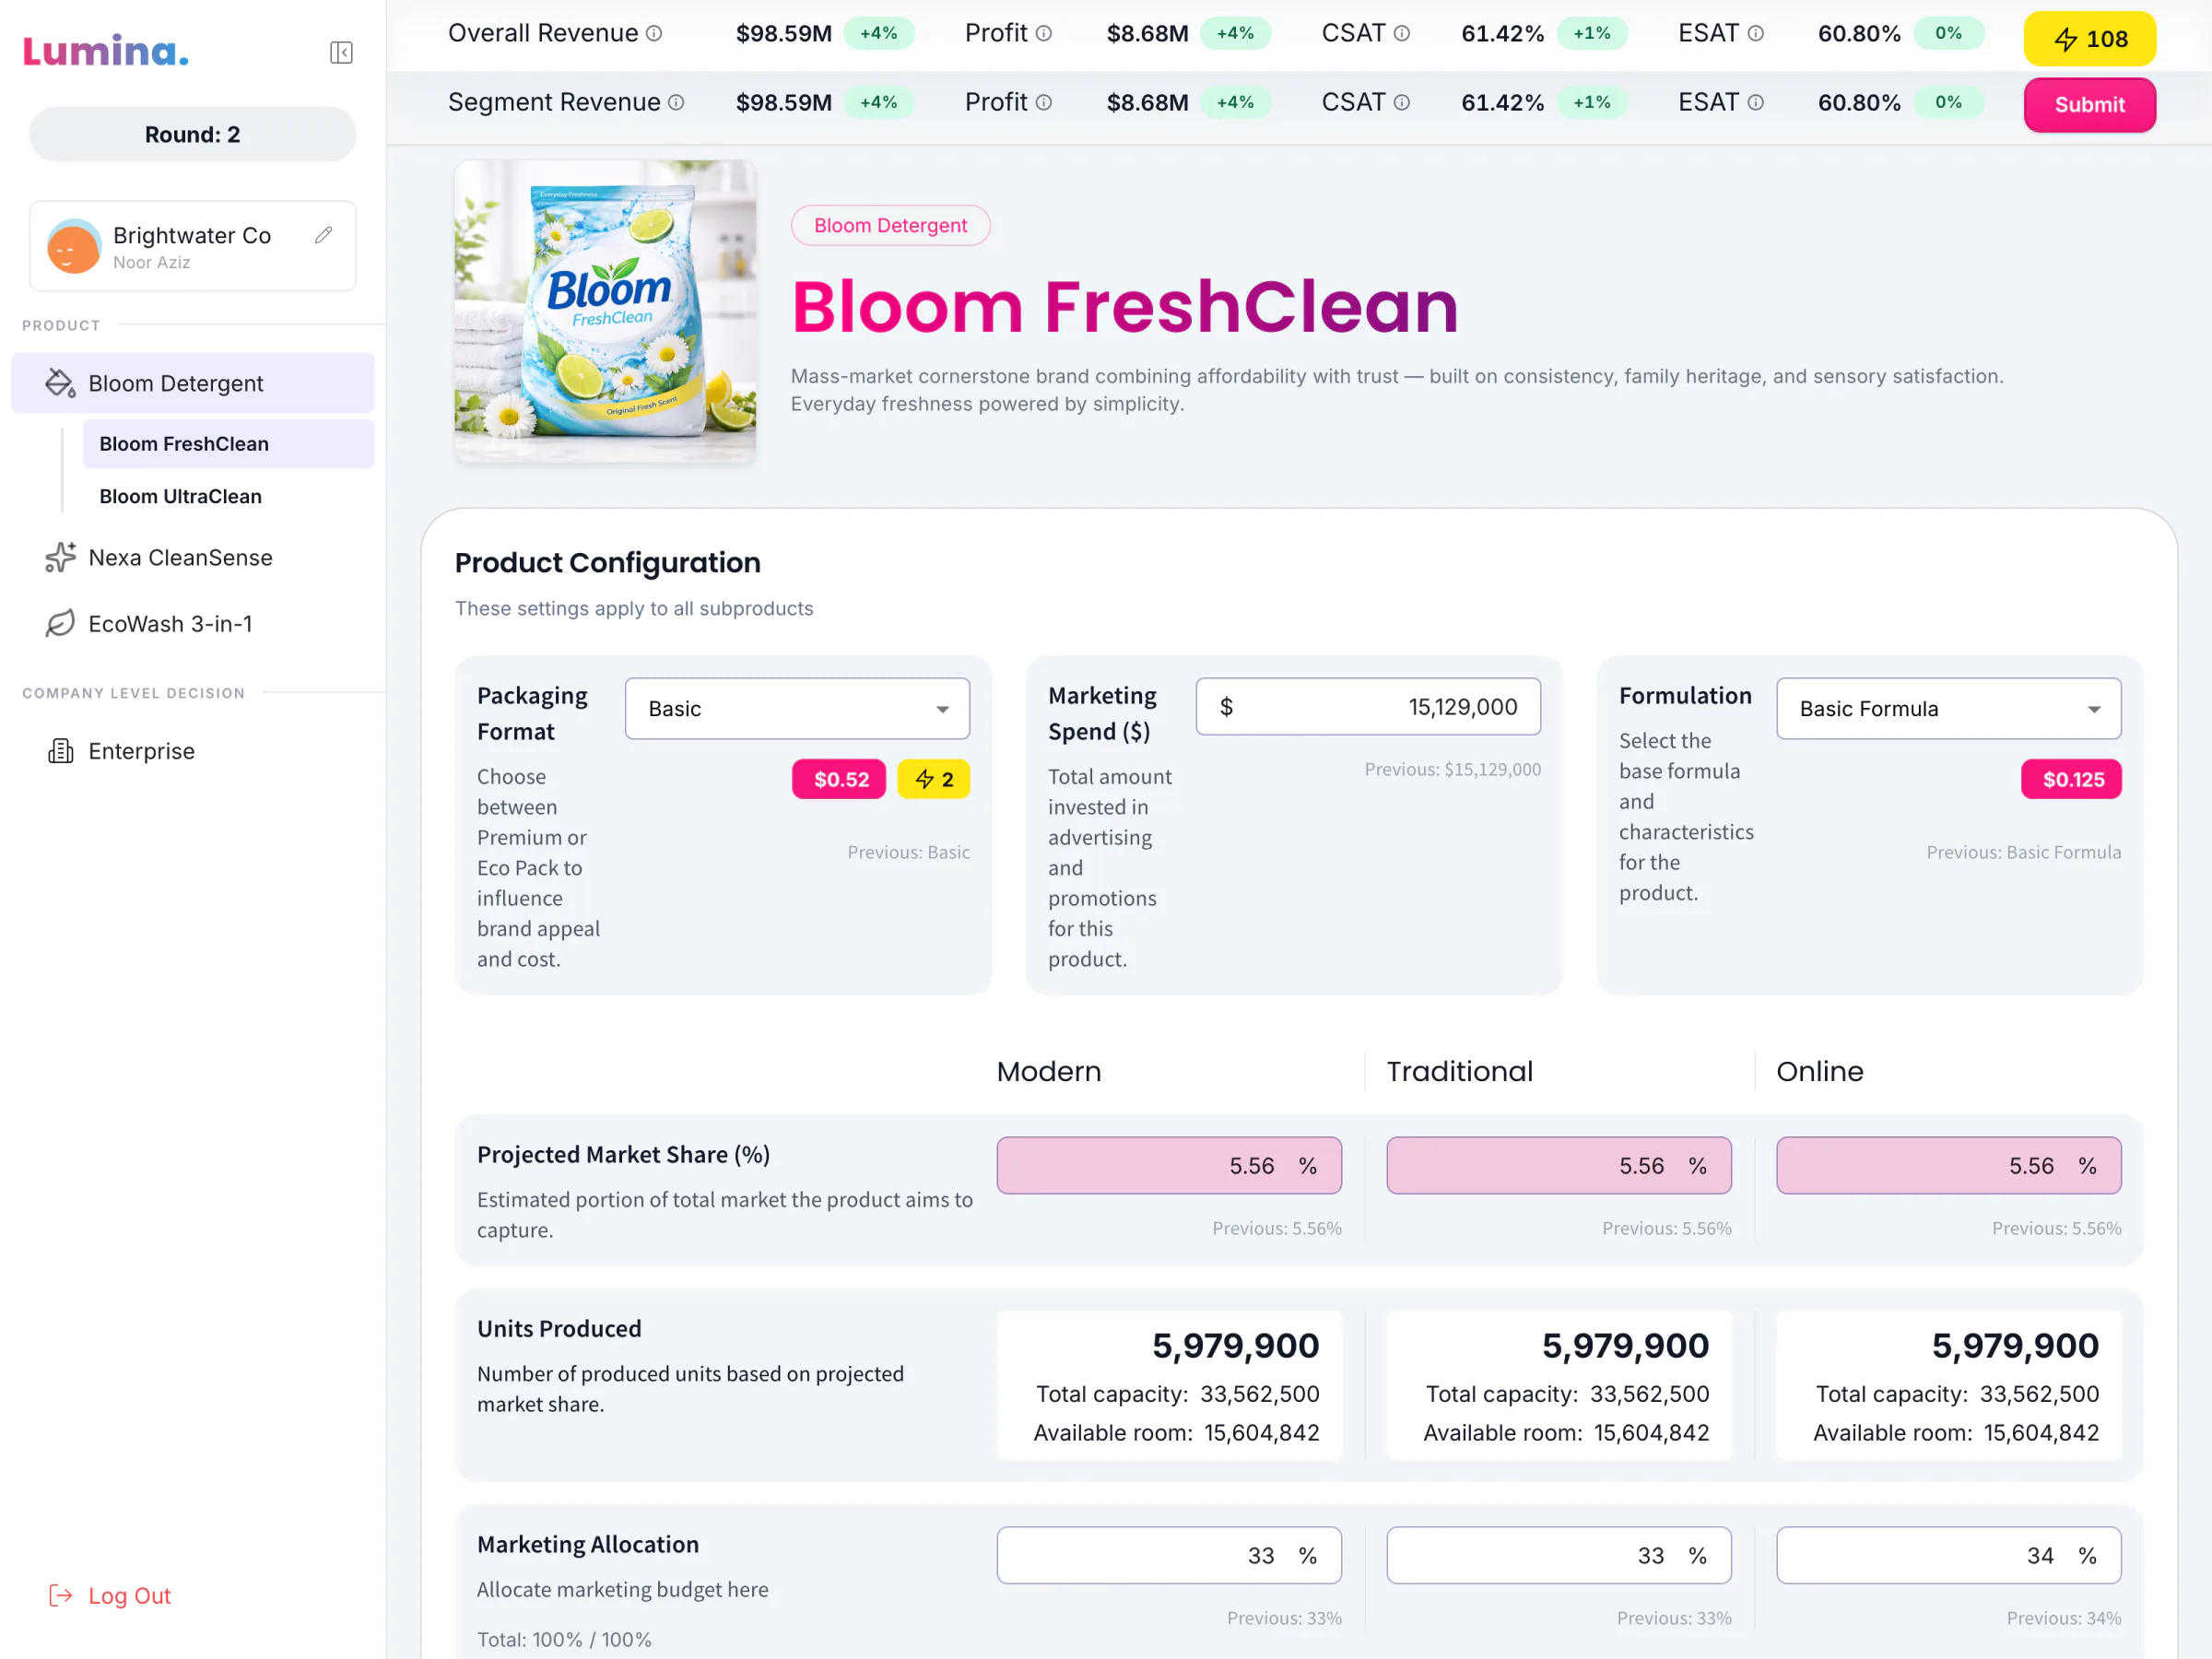
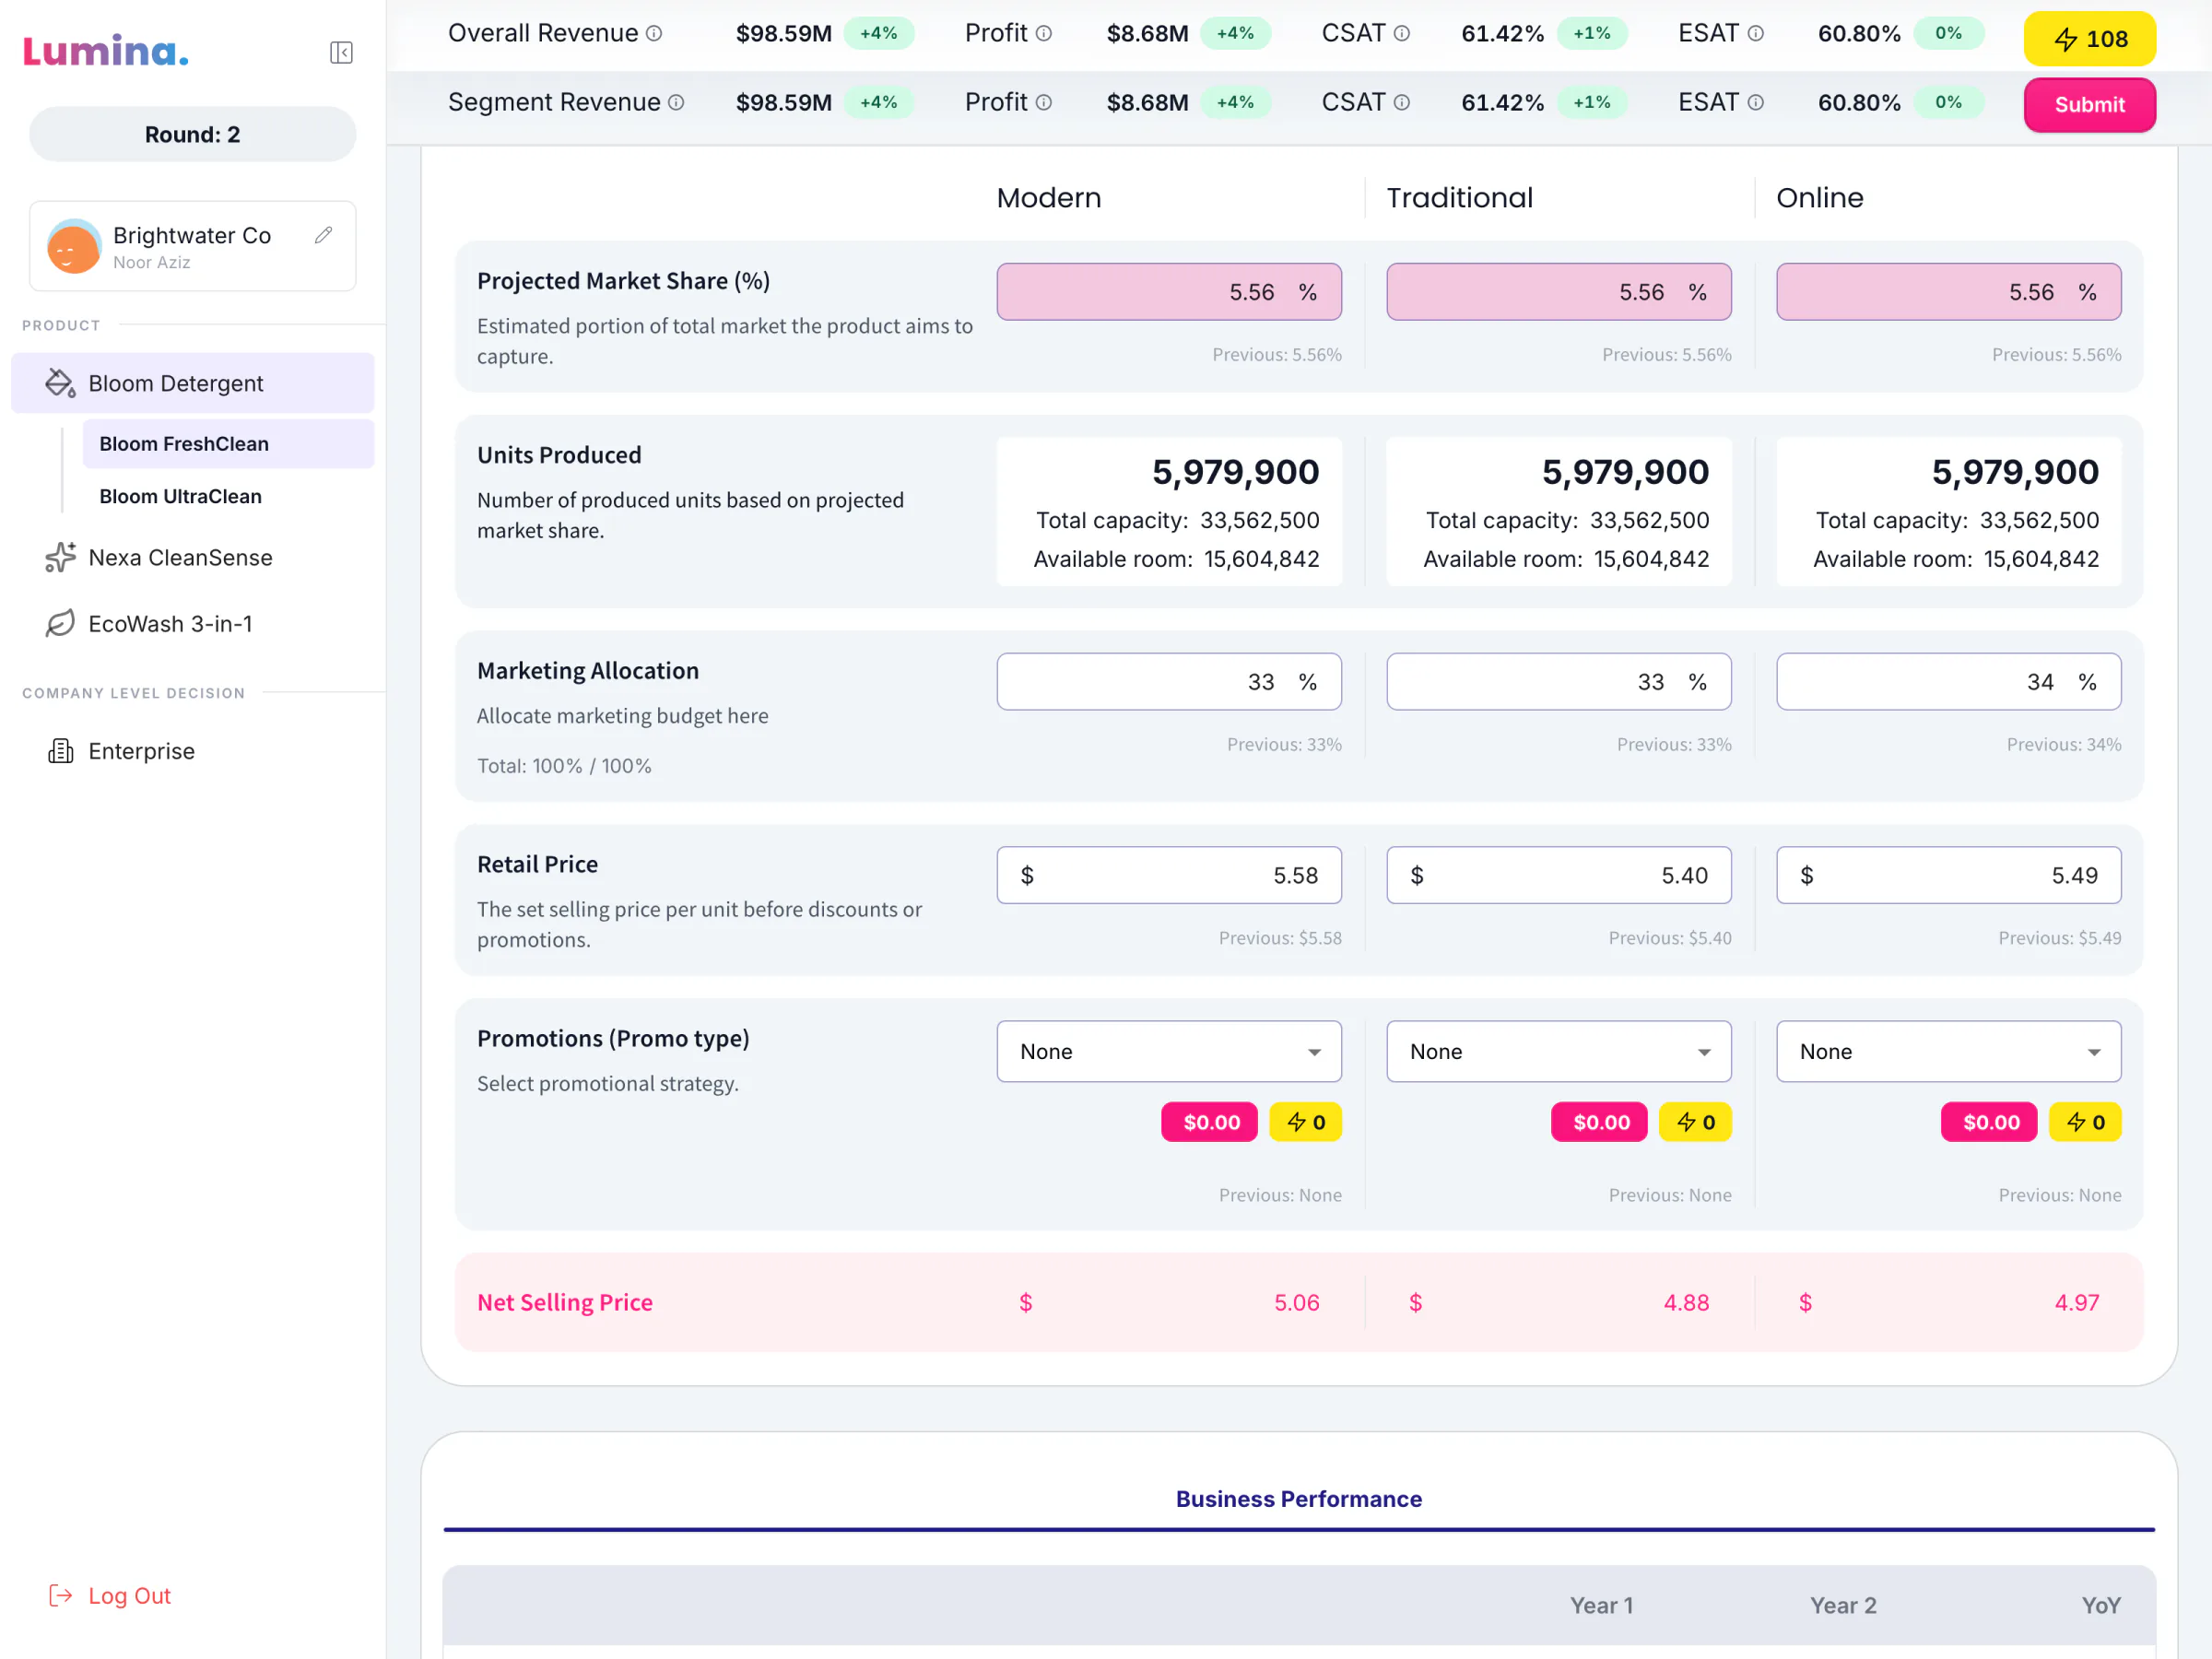
A channel table for Modern, Traditional and Online: share 5.56% each, 5,979,900 units each, marketing split, price and promotion.
40Channel by channel: share, units, marketing, price and promotion
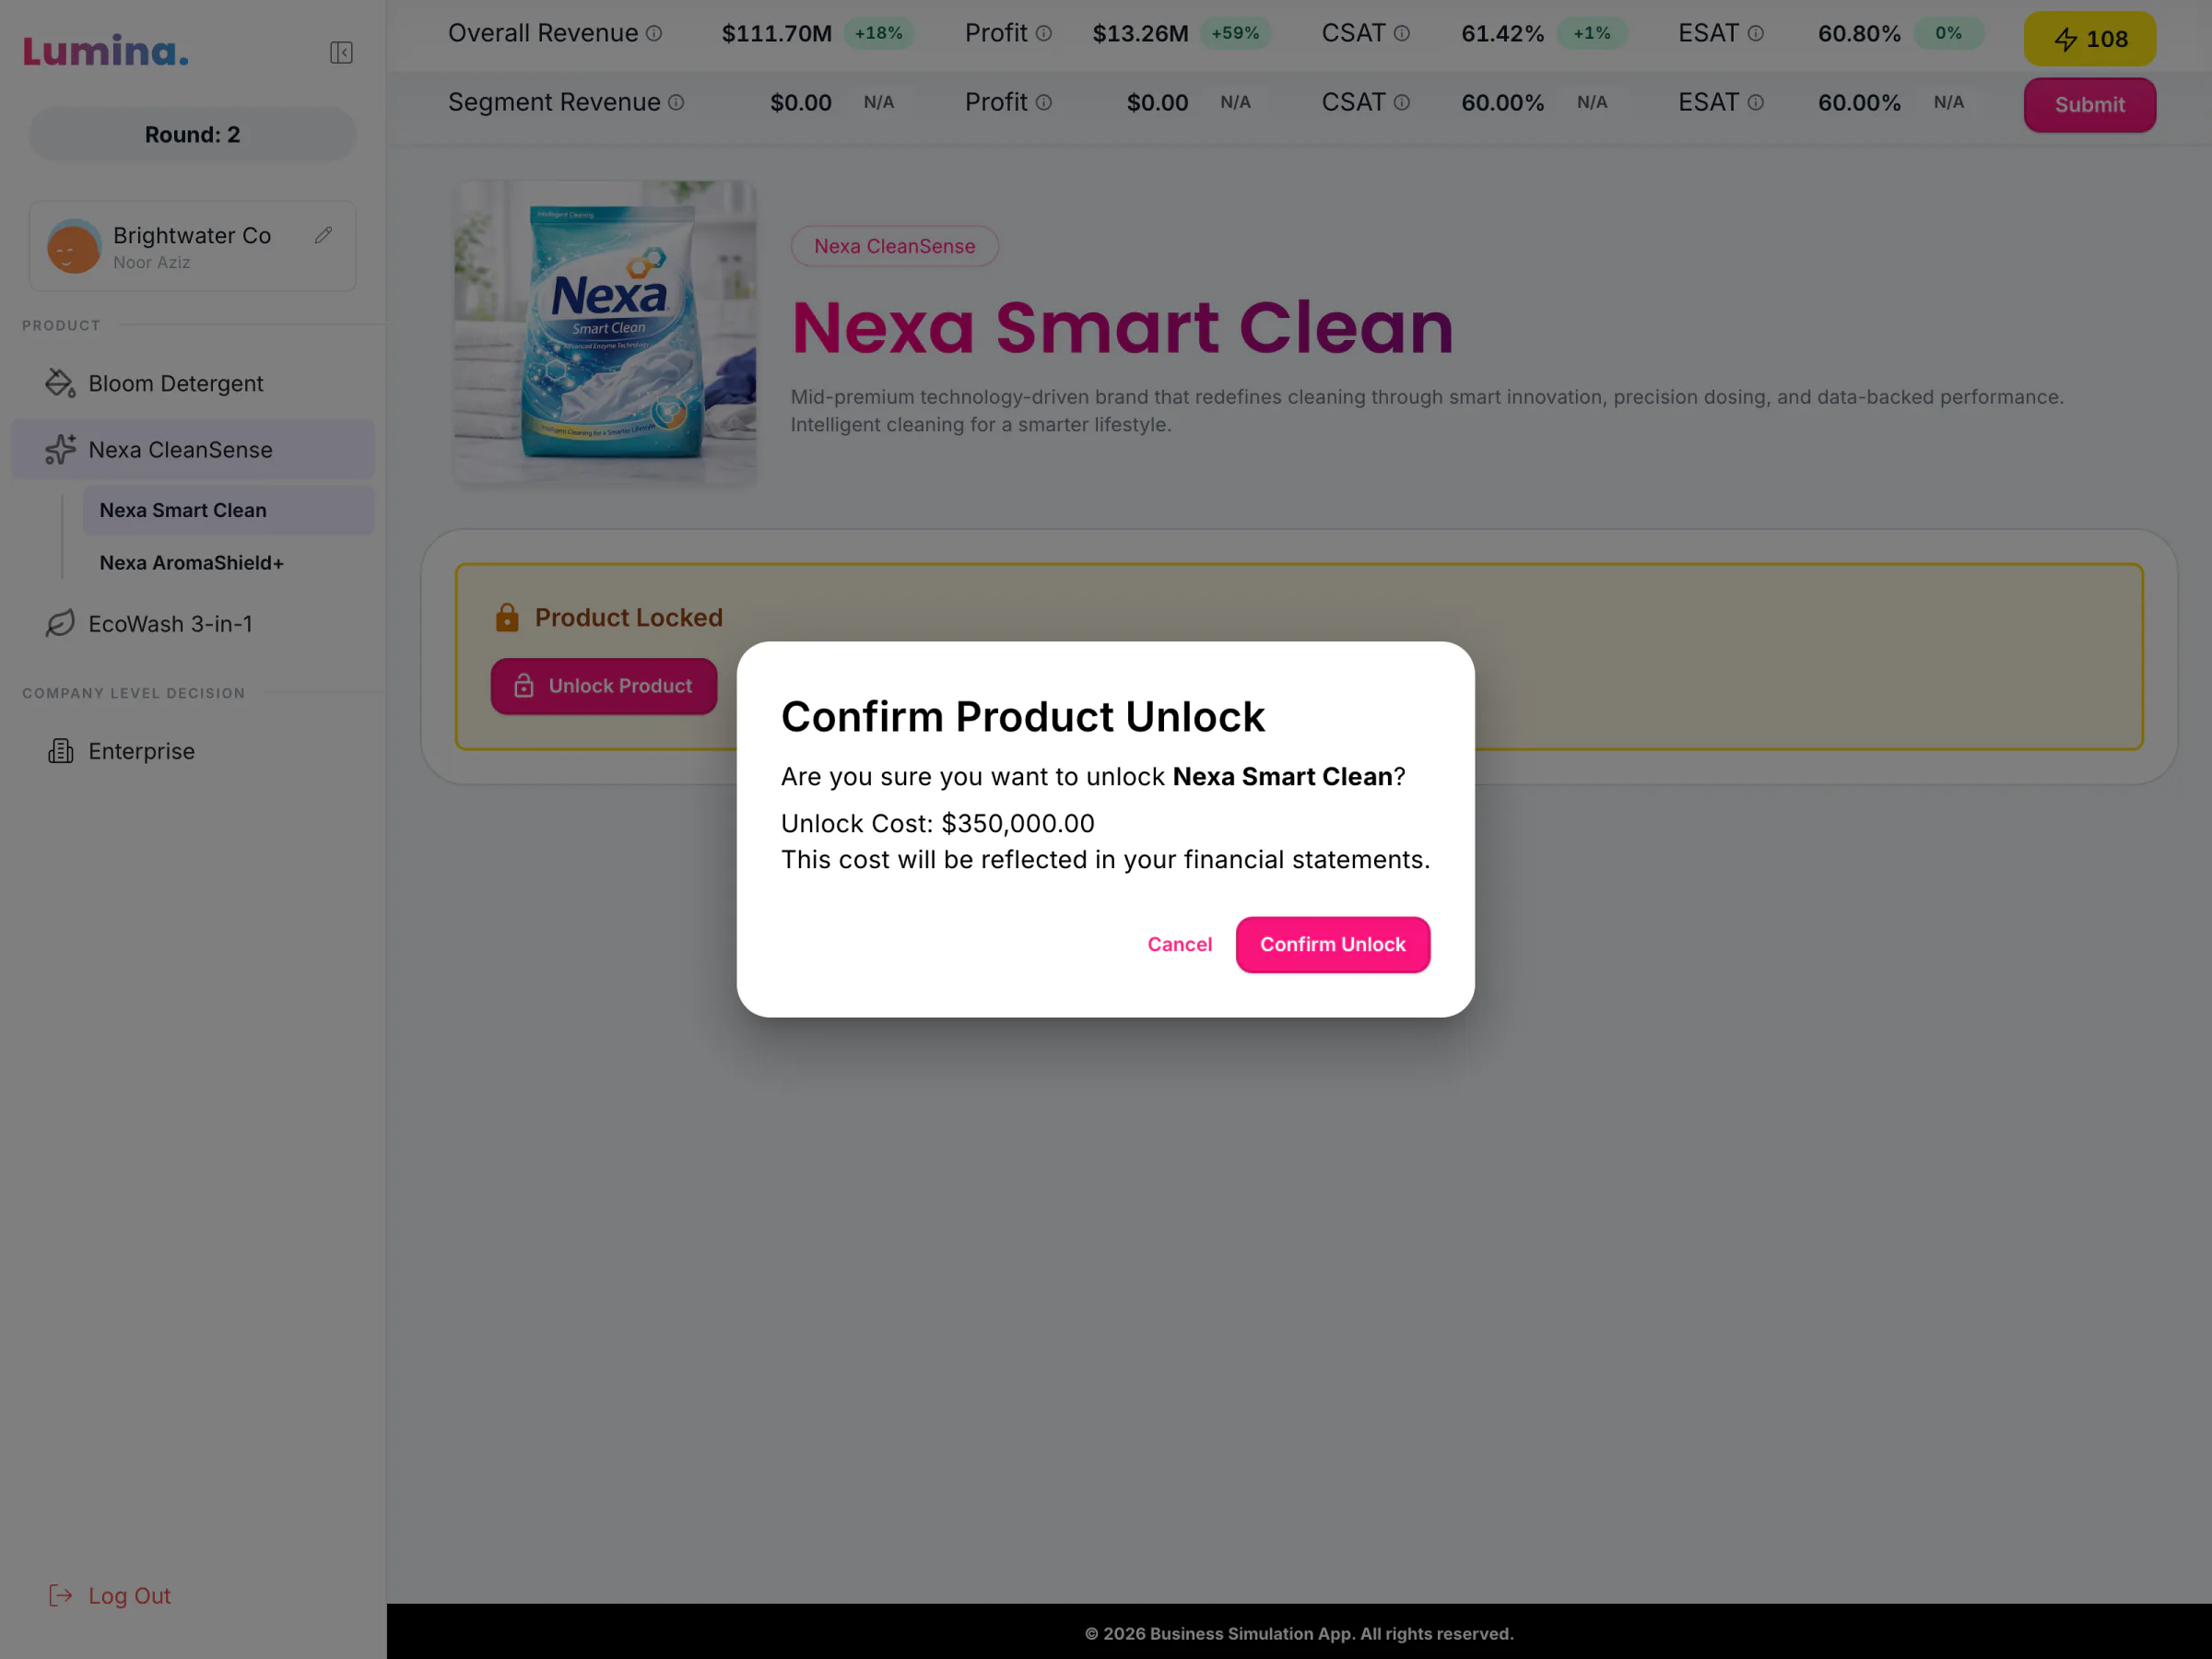
A dialog: "Confirm Product Unlock", asking to unlock Nexa Smart Clean for $350,000.00.
41A locked product opens for a cost
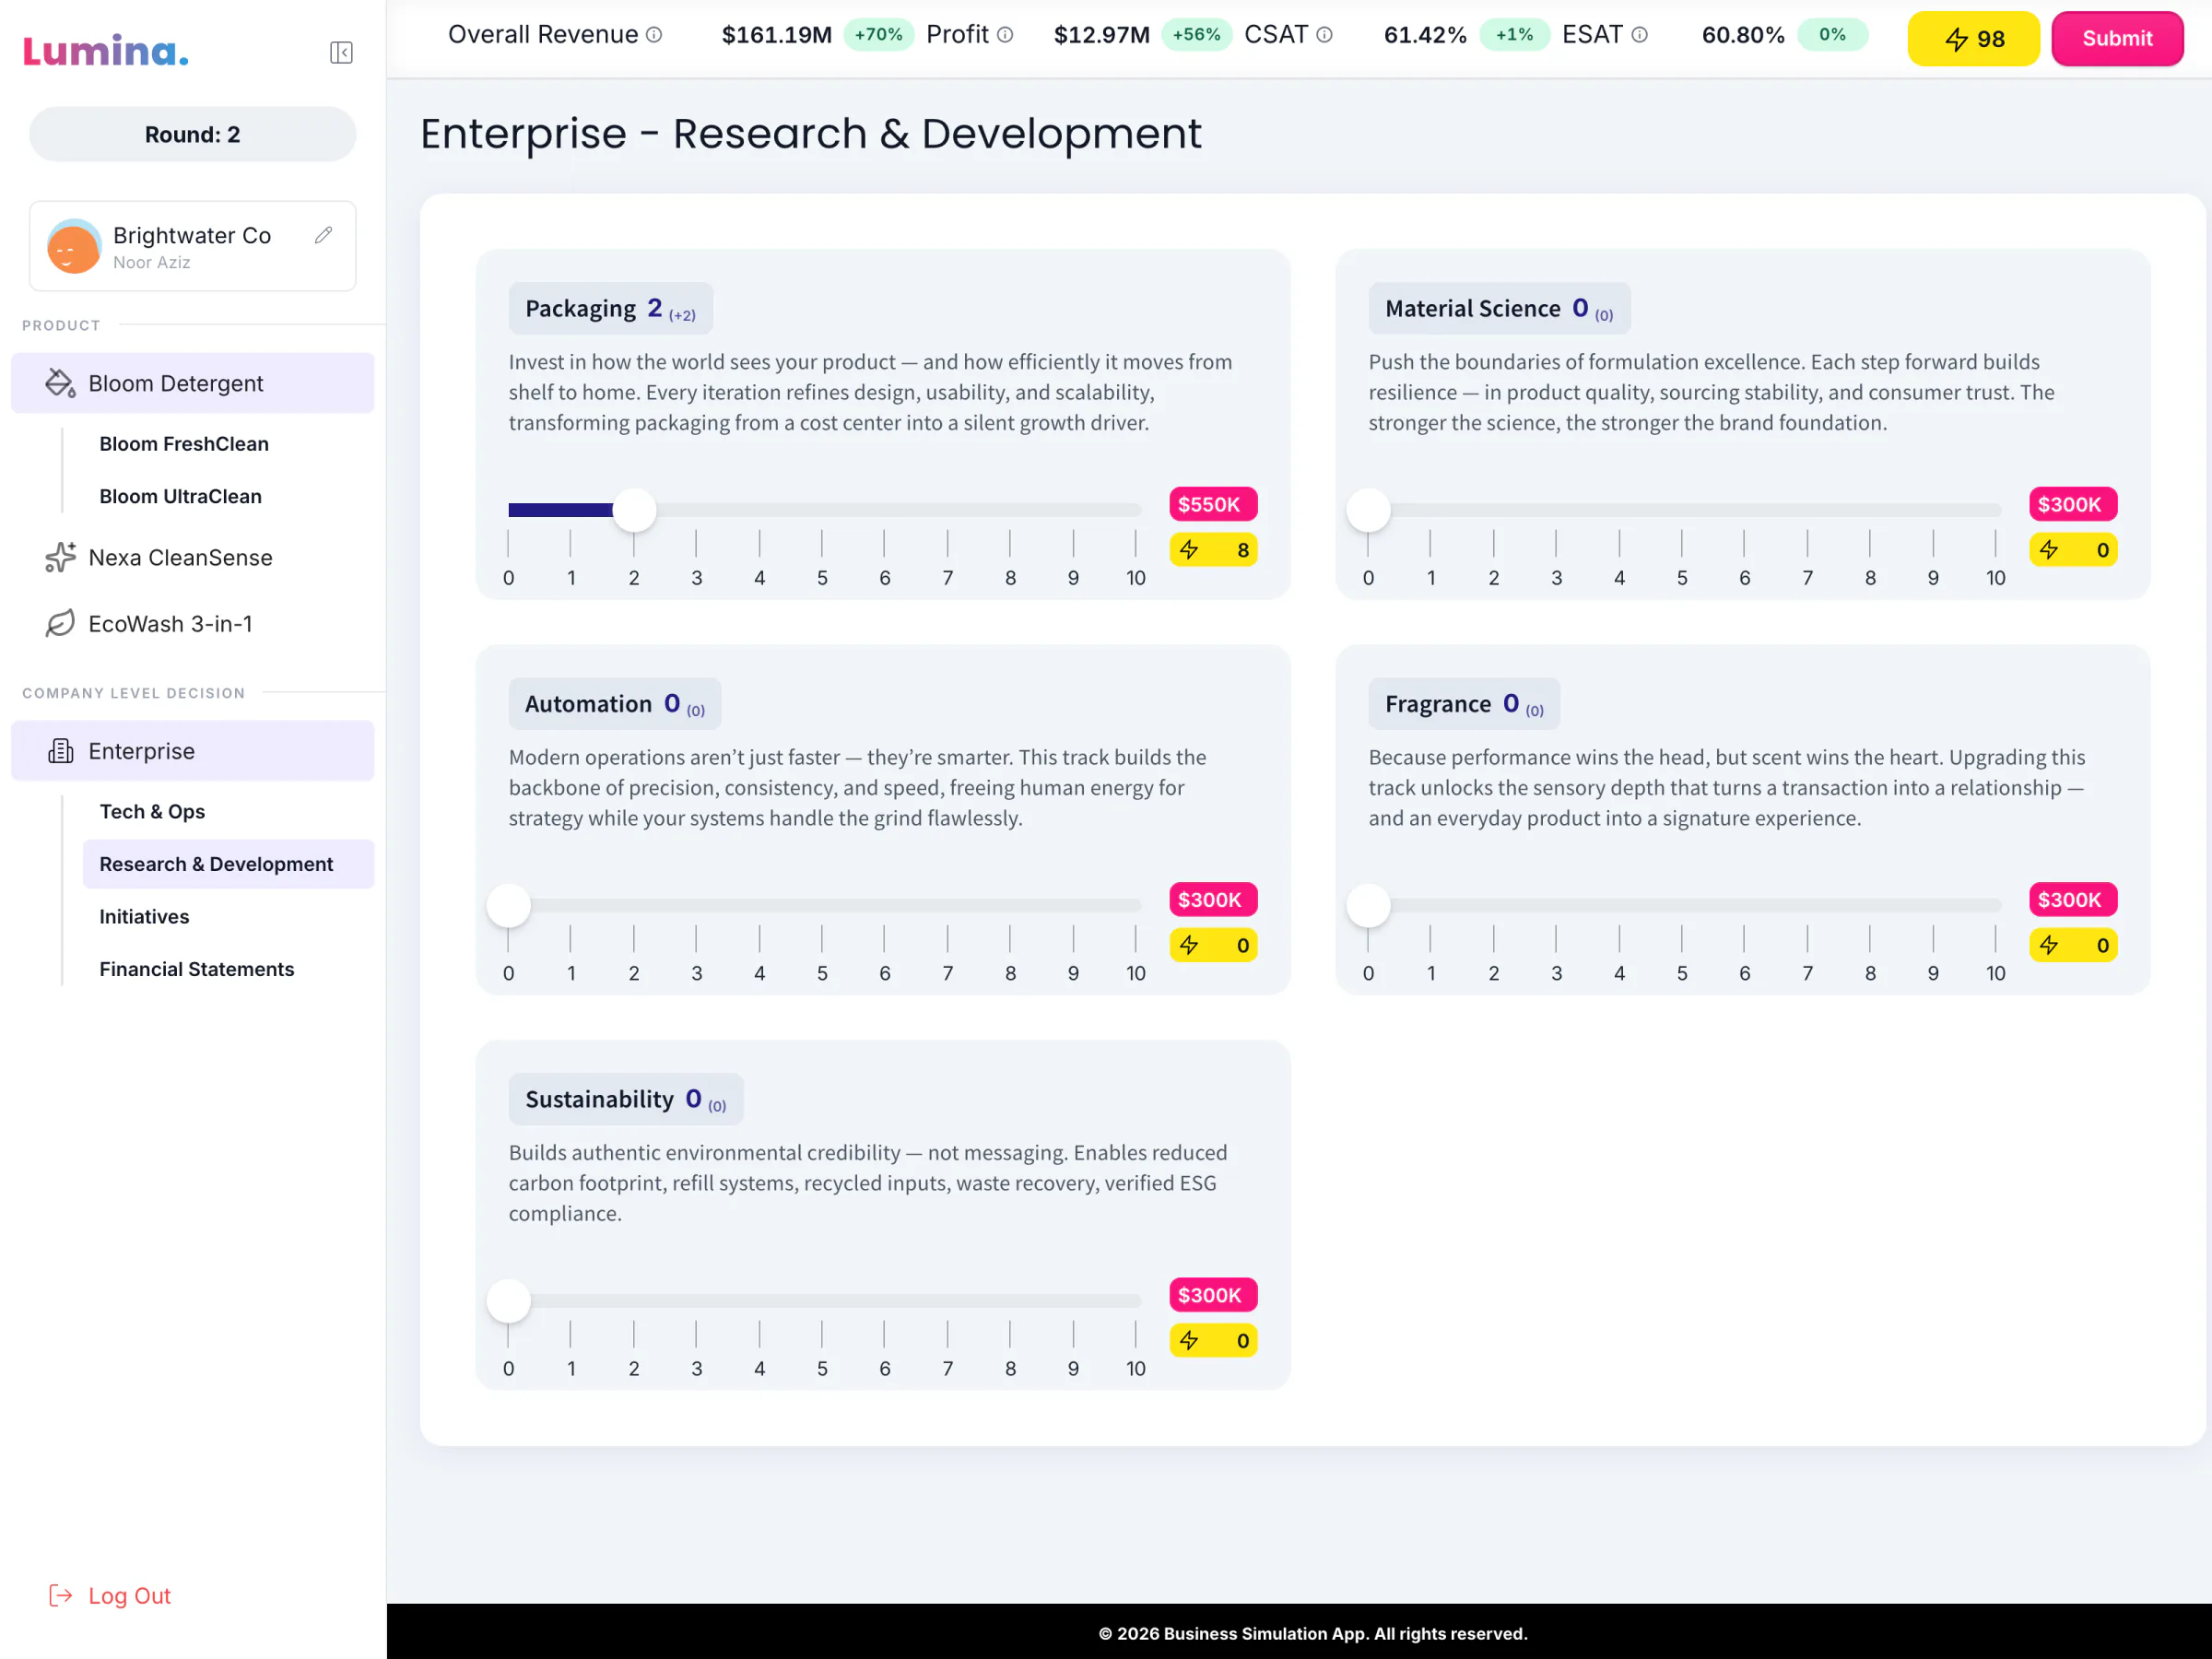
Research & Development: five level tiles; Packaging is raised to 2, with cost and energy chips.
42Research and development opens the rest
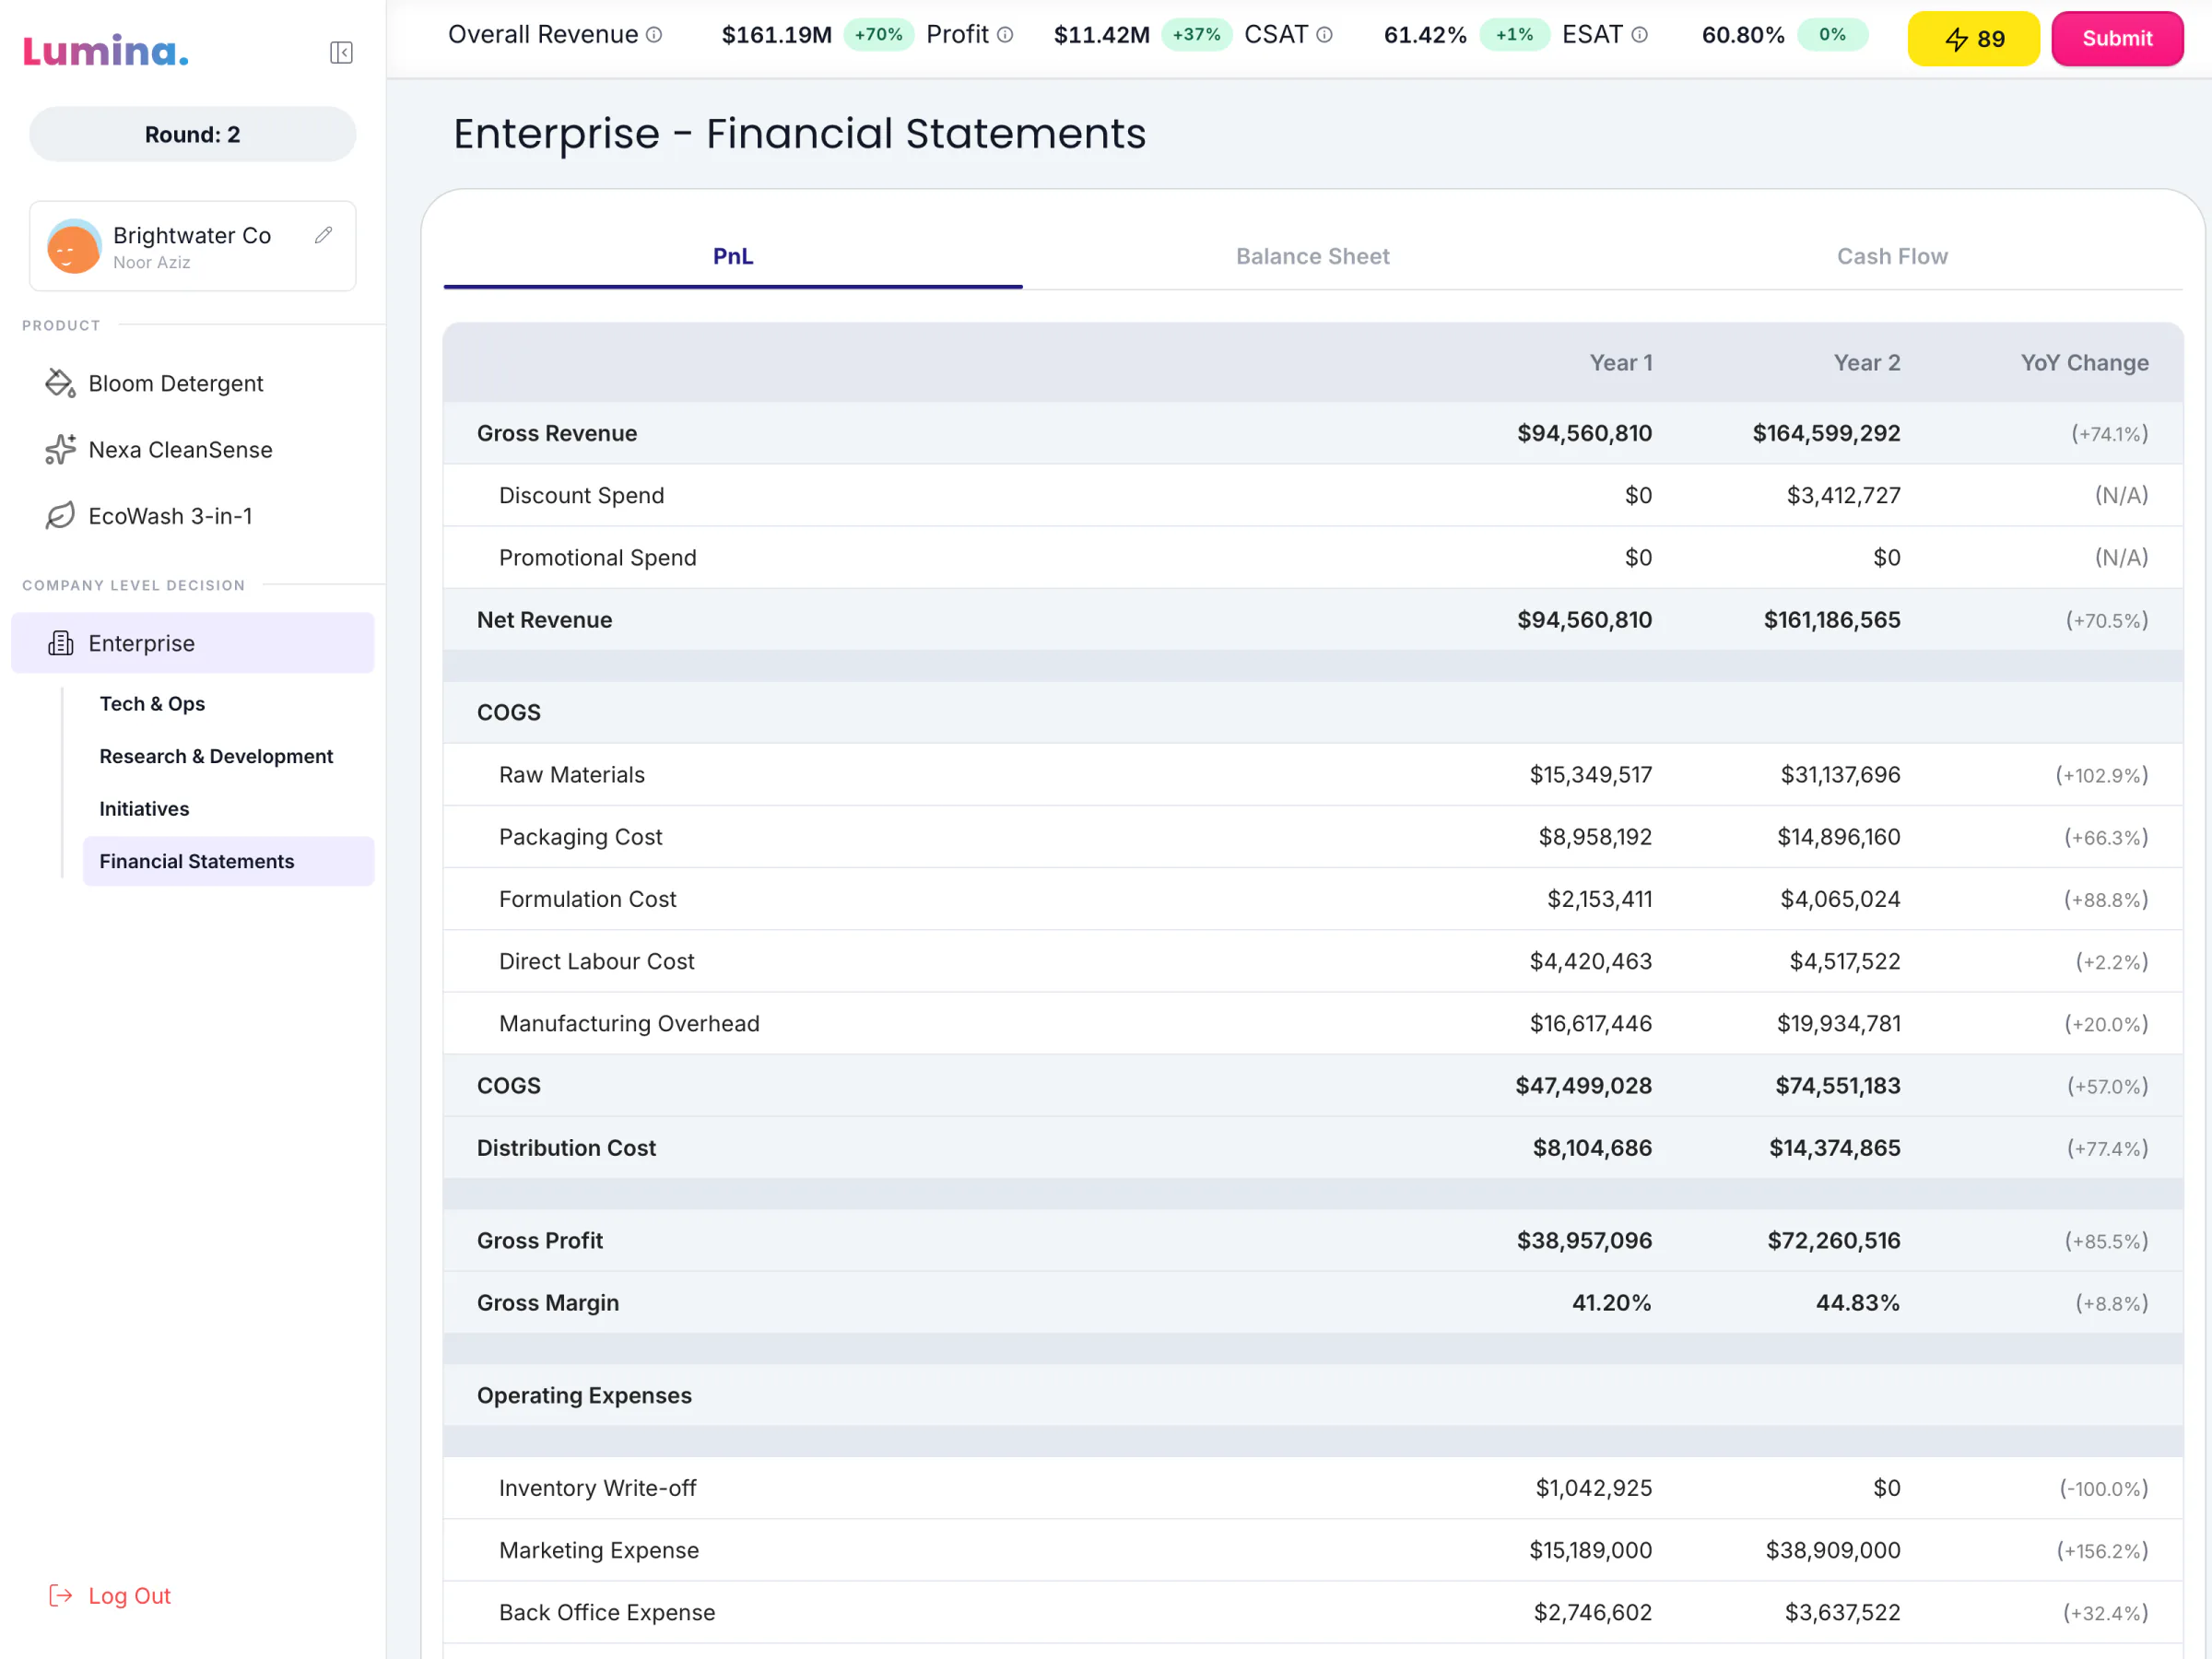
The PnL: gross revenue rises from $94,560,810 to $164,599,292 between Year 1 and Year 2.
43Each year closes with full statements
06

Mall: Run a Mall's Marketing Year

A two-round marketing game. Each team is the new Marketing Manager of a fictional flagship mall, with one fixed annual budget to split between a low season and a peak season. The team picks campaigns, funds four incentives and four channels inside each, and chooses a tenant strategy, all under an energy cap. Six figures come back, from Traffic to tenant satisfaction. In this game teams do not take shoppers from each other: competition is in the scoring, by rank on the six results. Mall's player is still on MUI. In the pictures its in-game brand is replaced with a neutral name.

  • 9 campaigns, 9 inputs inside each, and at most 11 live inputs in round 1.
  • Budget and energy are both enforced; a refused change flashes the budget bar red.
  • Guarded by a byte-for-byte replay of a recorded session; the engine has no unit tests.
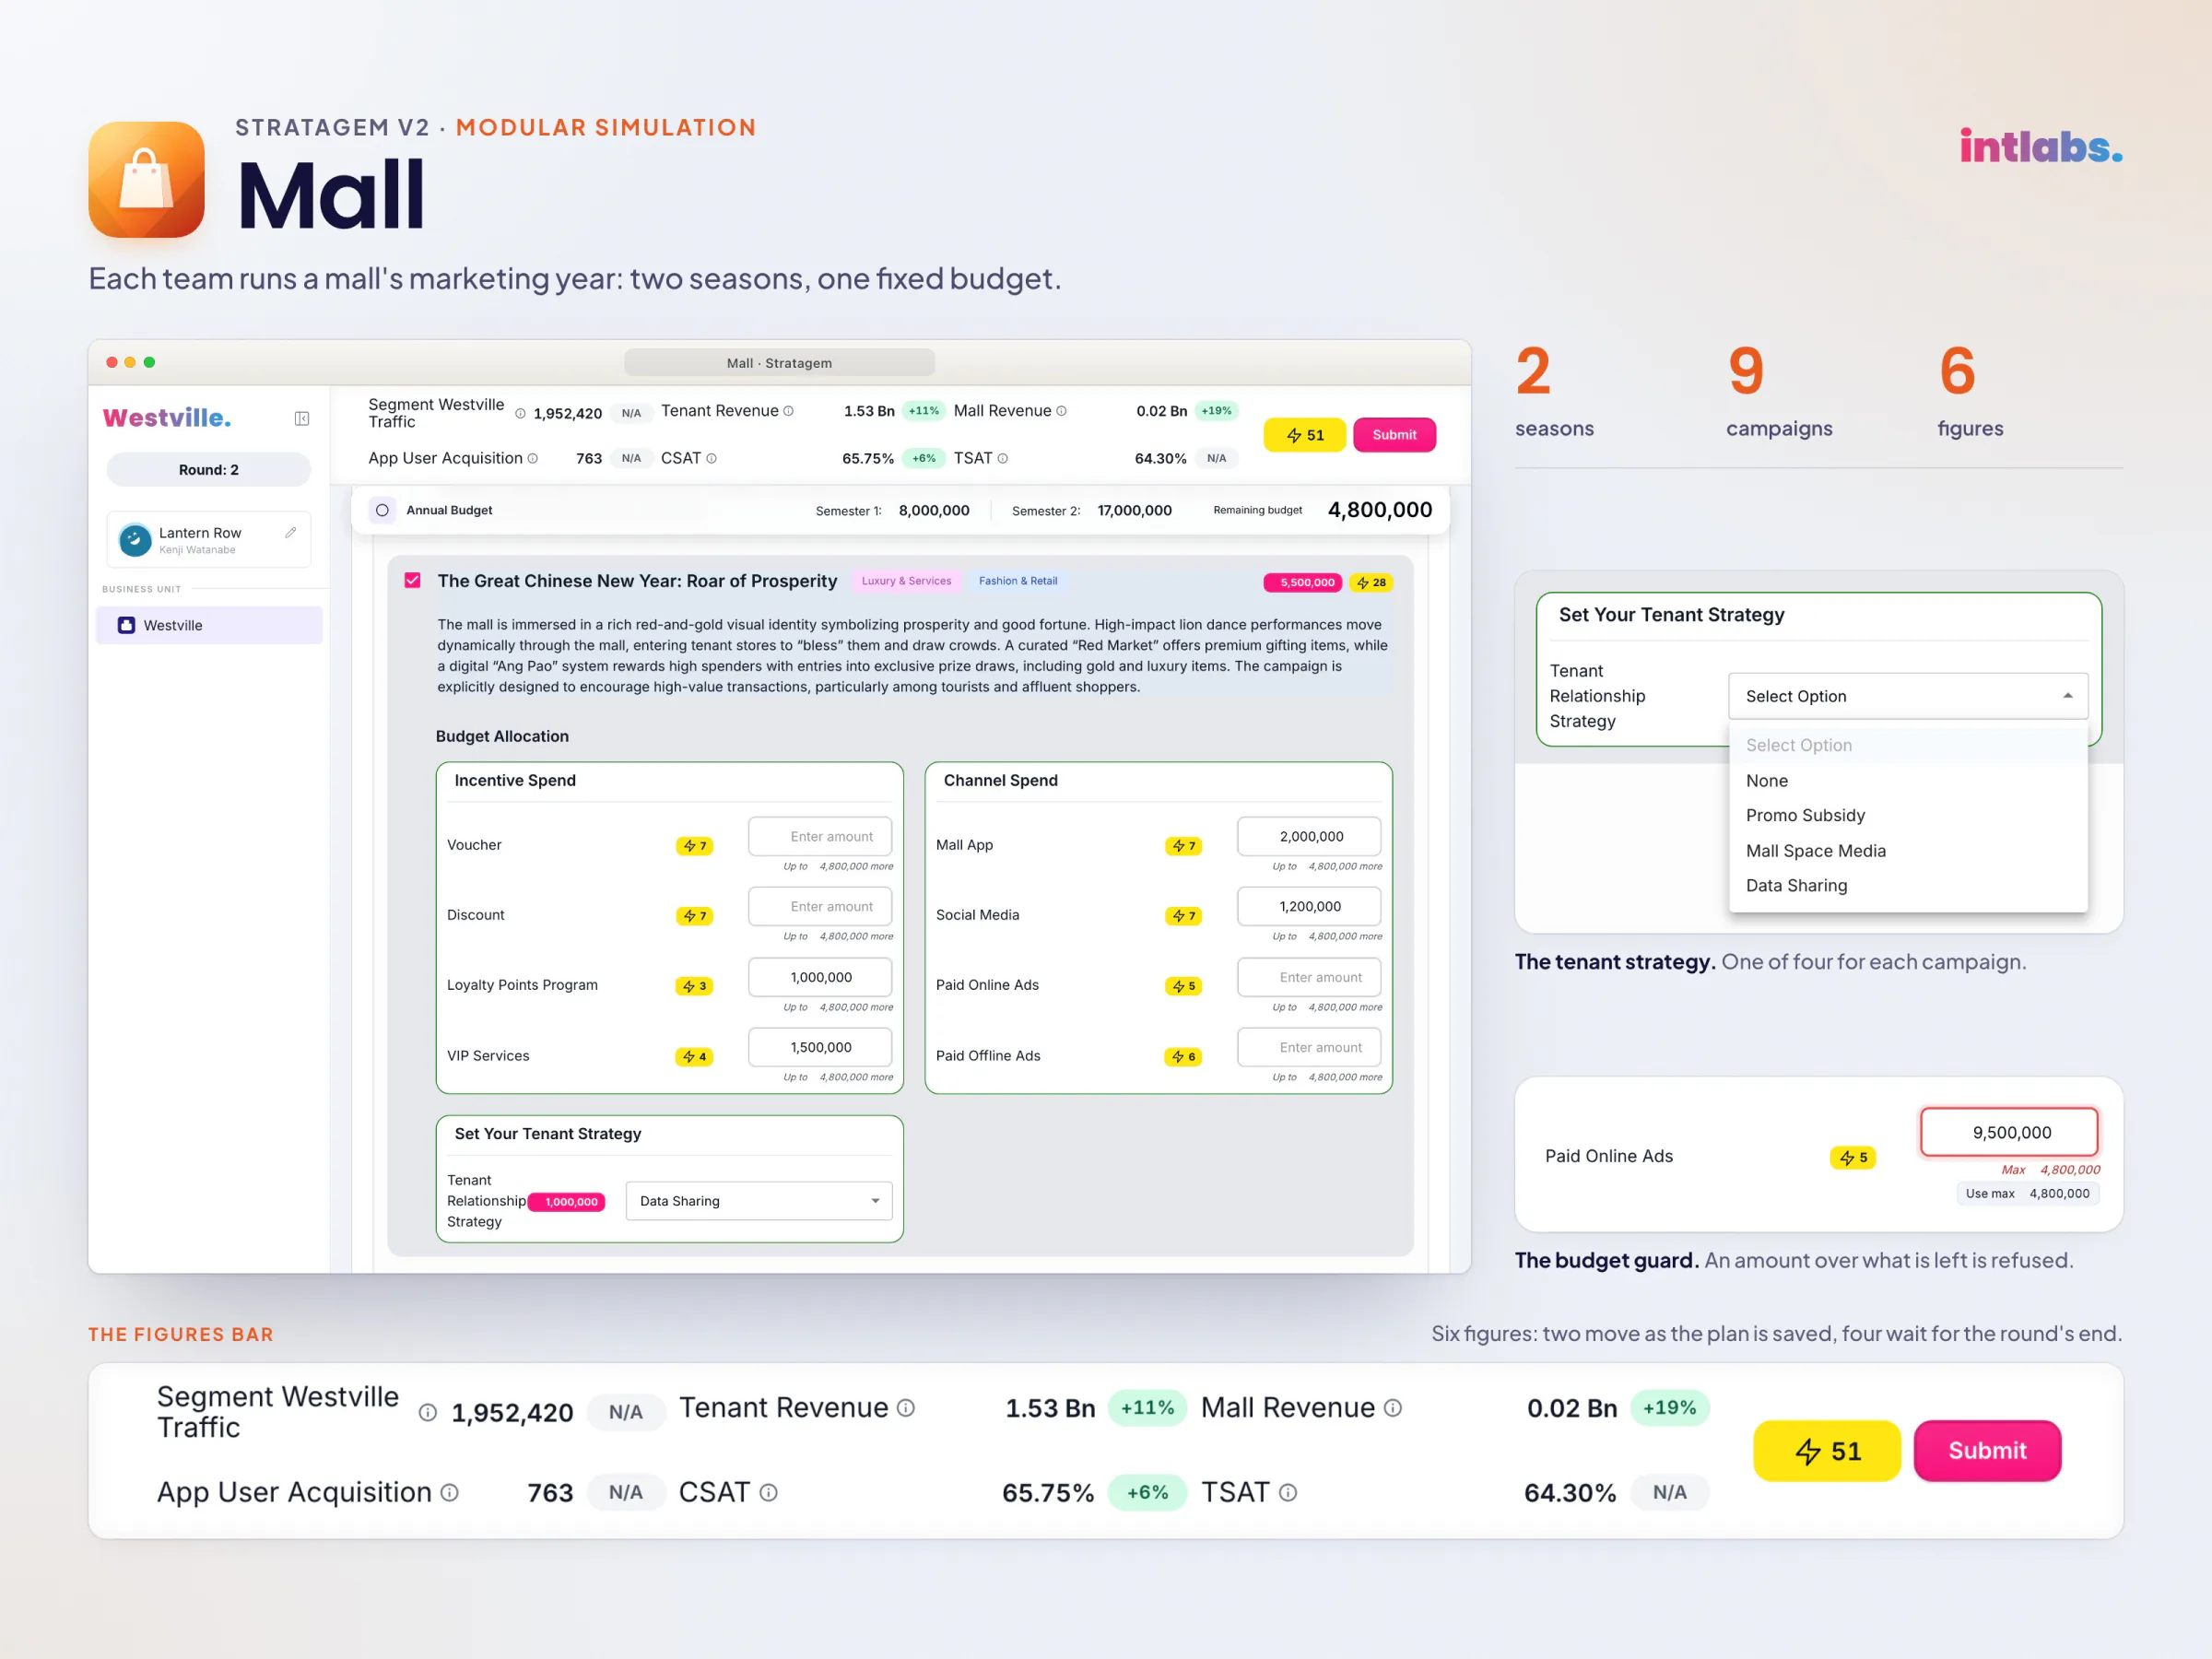
A Mall poster: a ticked campaign with its spend tables, a tenant strategy menu and a figures bar; 2 seasons, 9 campaigns, 6 figures.
44Mall on one sheet
07

A Design System Built From Figma

The design system replaces MUI screen by screen, without breaking the running apps. Its 867 tokens come in three tiers and generate a locked theme: a class that is not a token generates nothing. On top sit 105 components, from buttons and tables to game parts such as the figures bar, the energy pill and decision tiles. The five chart types are drawn by hand, with no chart library, and each can be read by keyboard and by screen reader. 231 Storybook stories carry interaction tests and screenshot baselines. Figma is the spec, and the 39 places where the system departs from it each give a reason.

  • 867 tokens, 23 text roles, 105 components, 231 stories and 211 screenshot baselines.
  • Lint refuses raw colours, arbitrary values and MUI imports.
  • The Admin has no MUI left; Banking and ET Prime are part way; Product and Mall have not started.
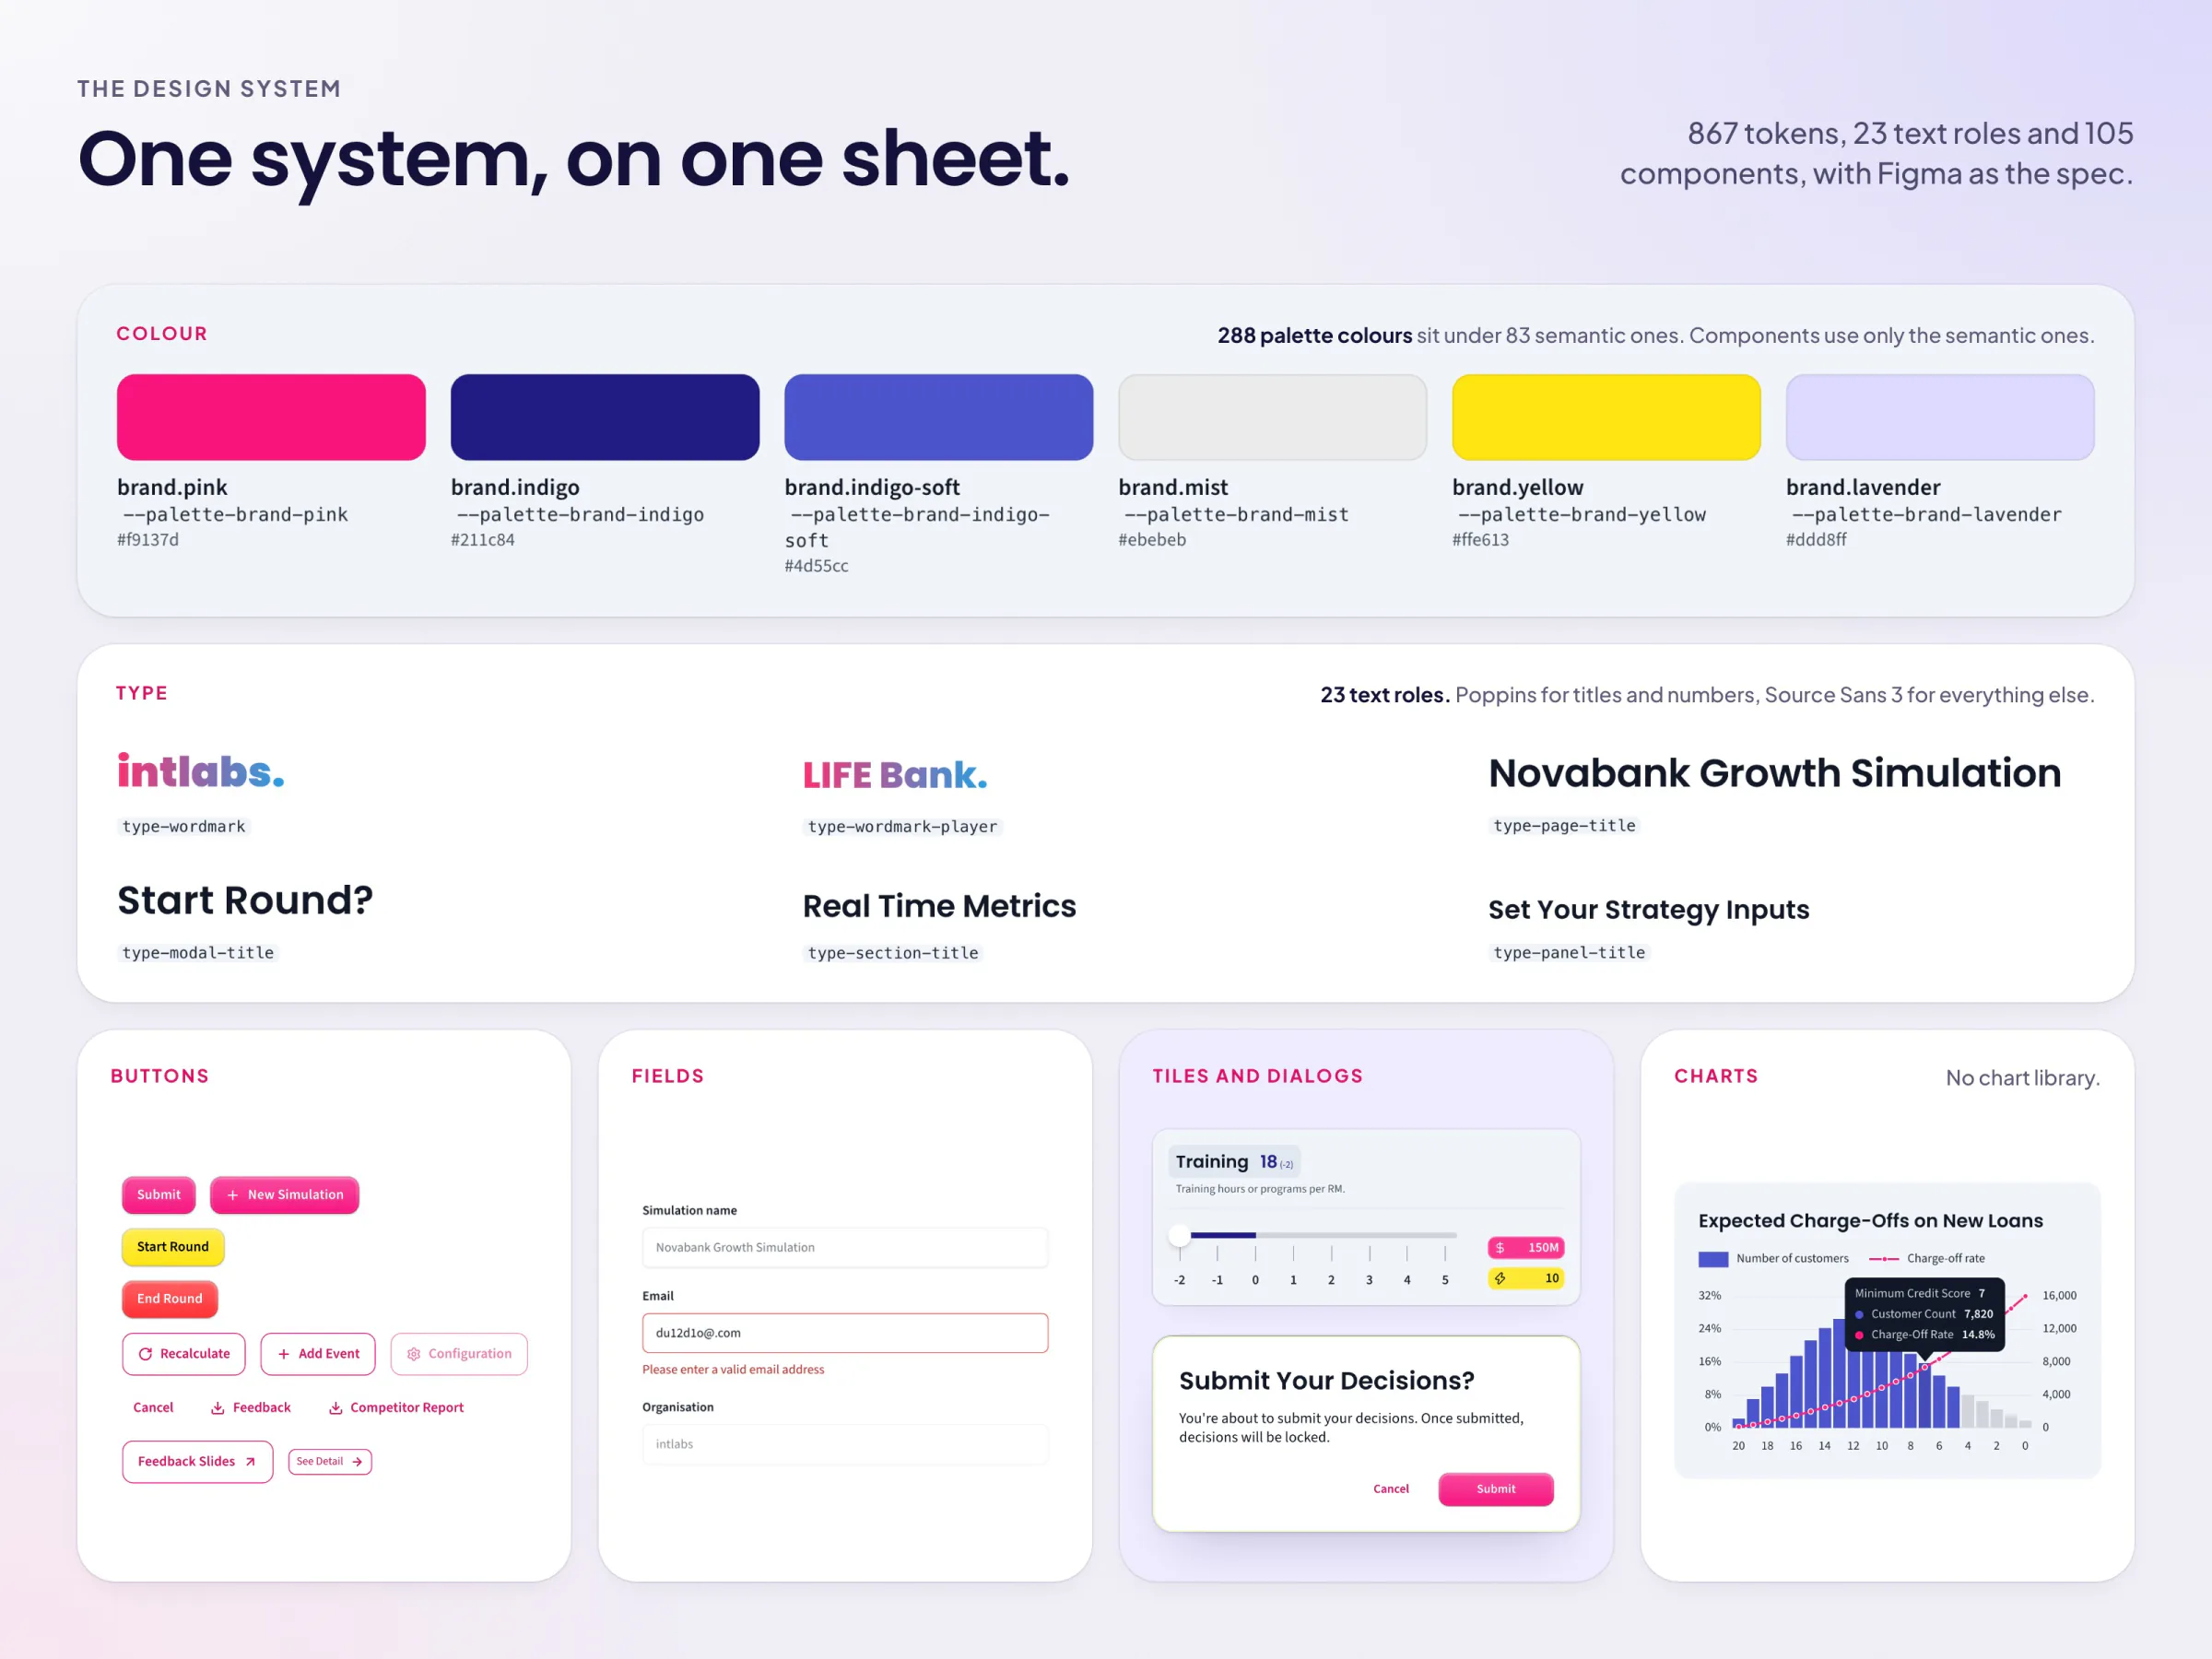
One sheet of a design system: colour swatches, text roles, buttons, fields, tiles, dialogs and a chart; 867 tokens, 23 text roles, 105 components.
45One system, on one sheet
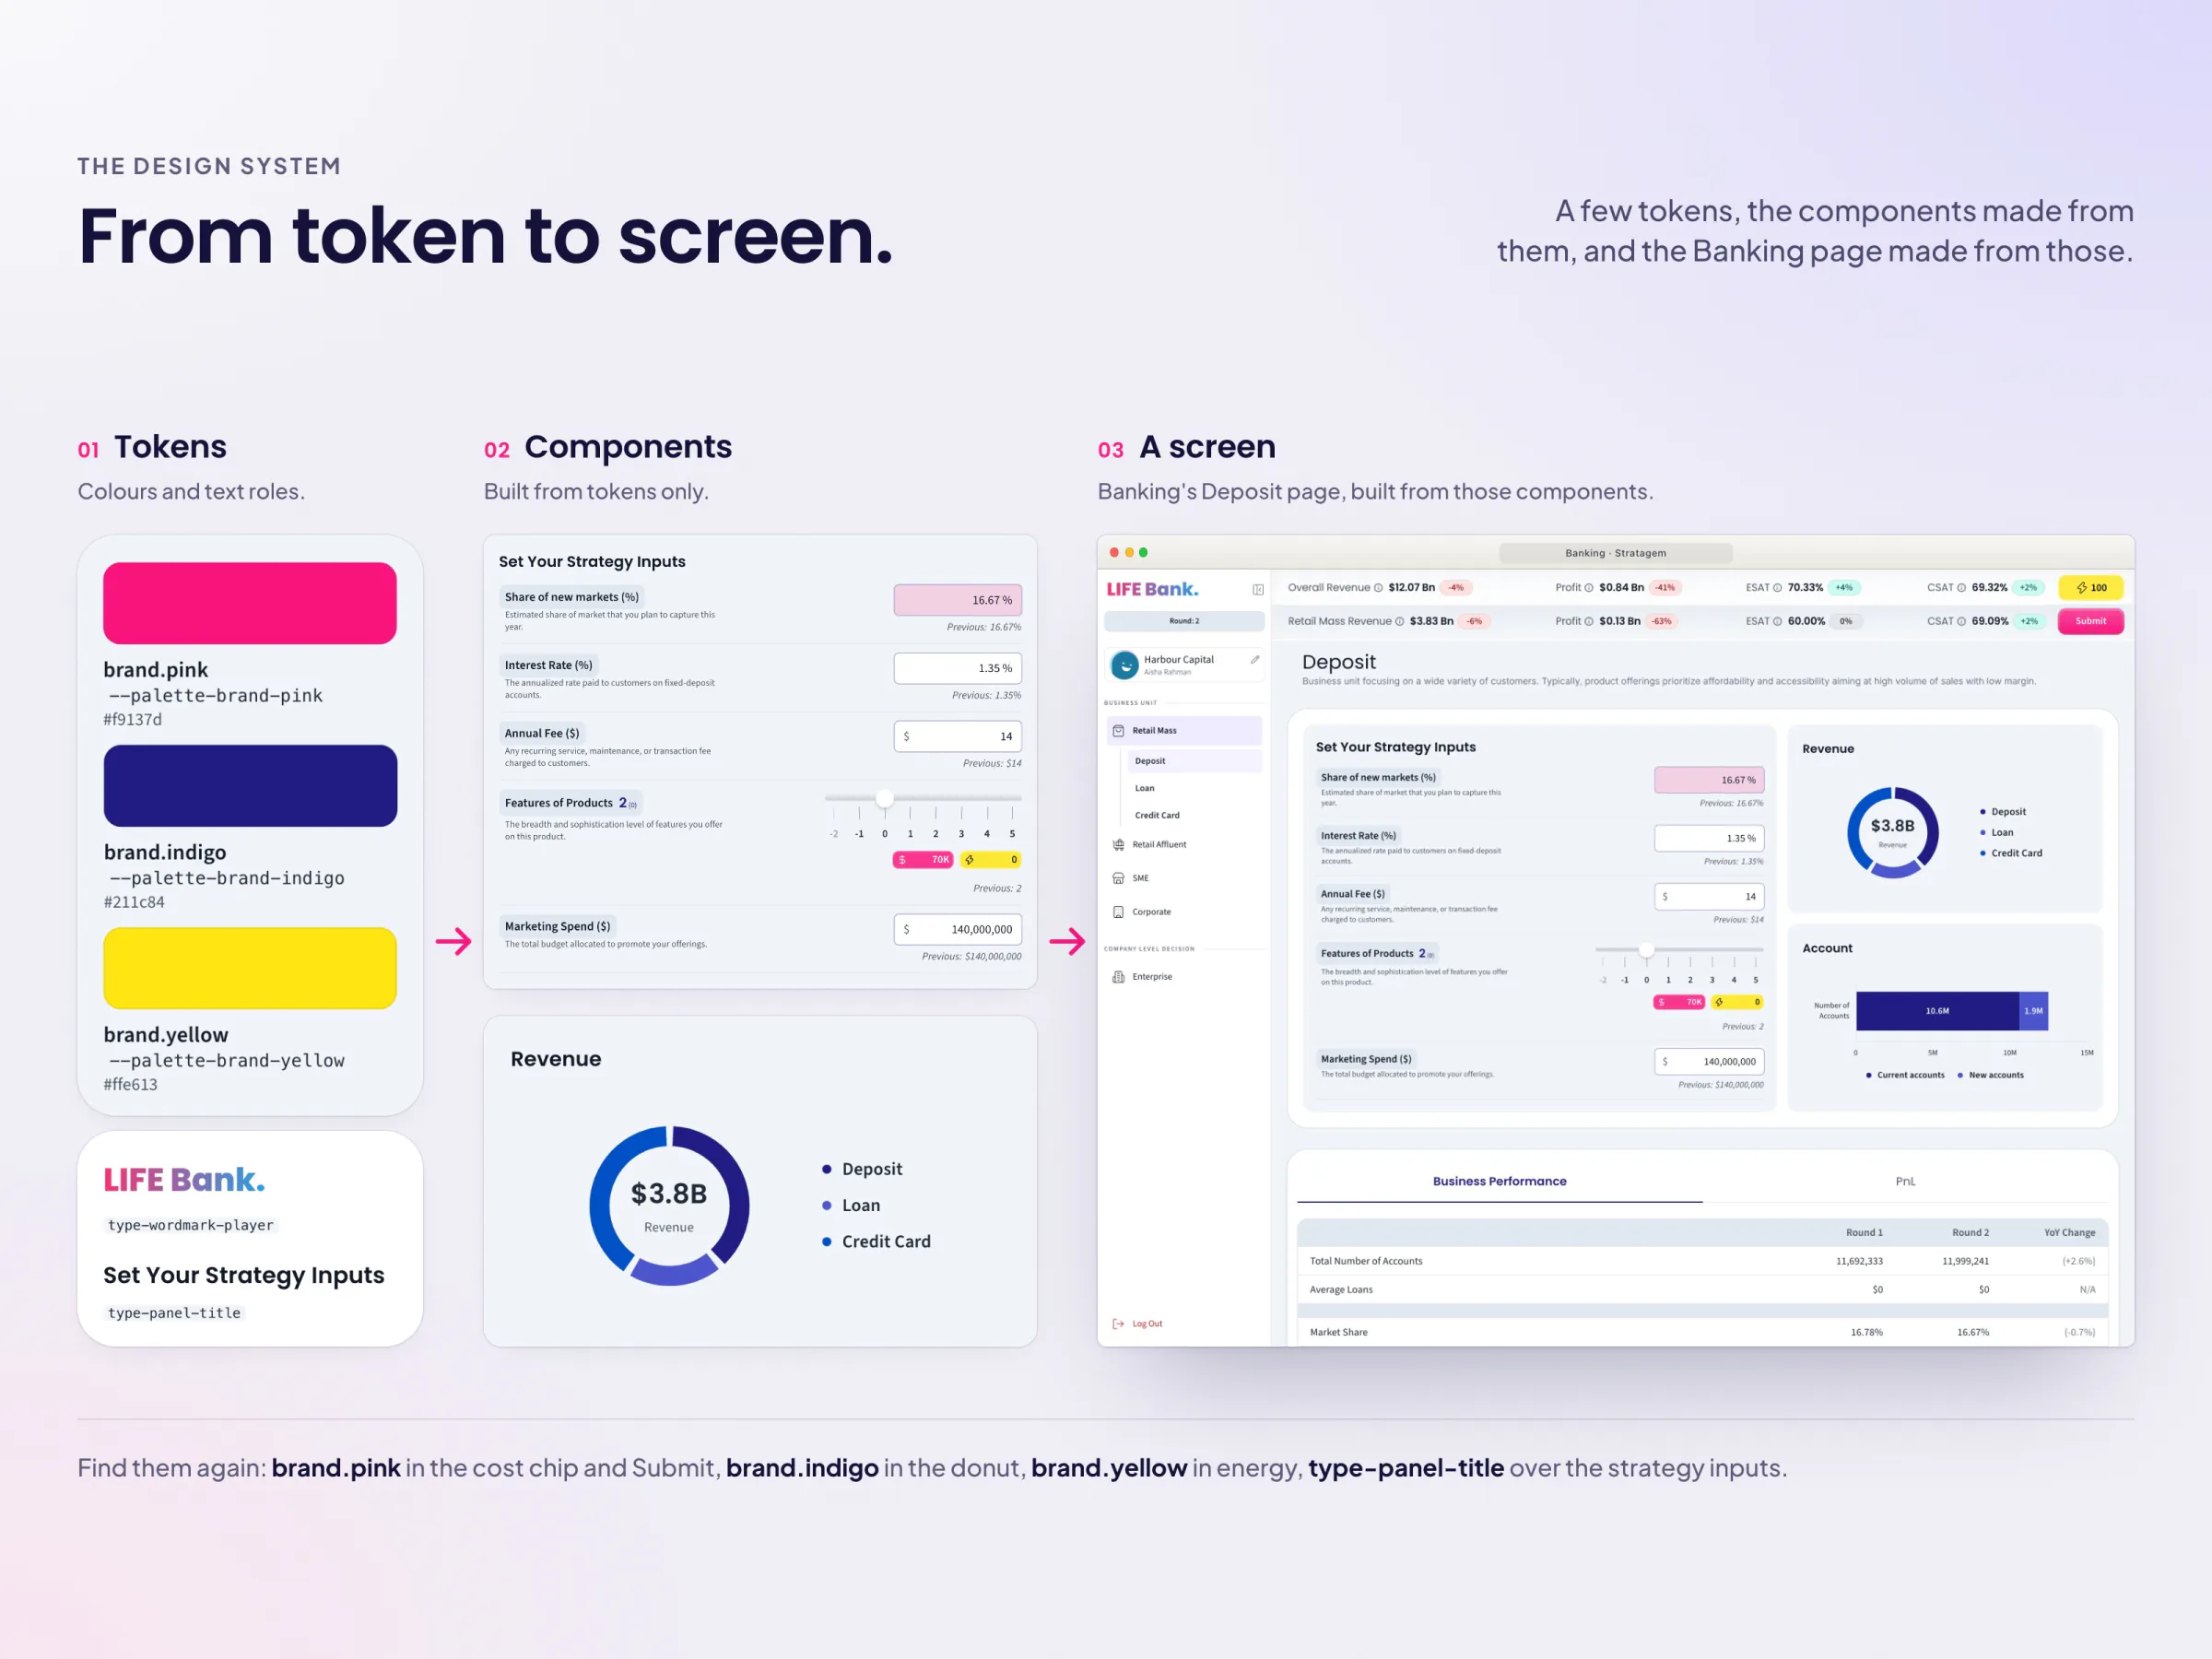
Three numbered columns under "From token to screen.": tokens, components, and a full Banking page.
46From token to screen
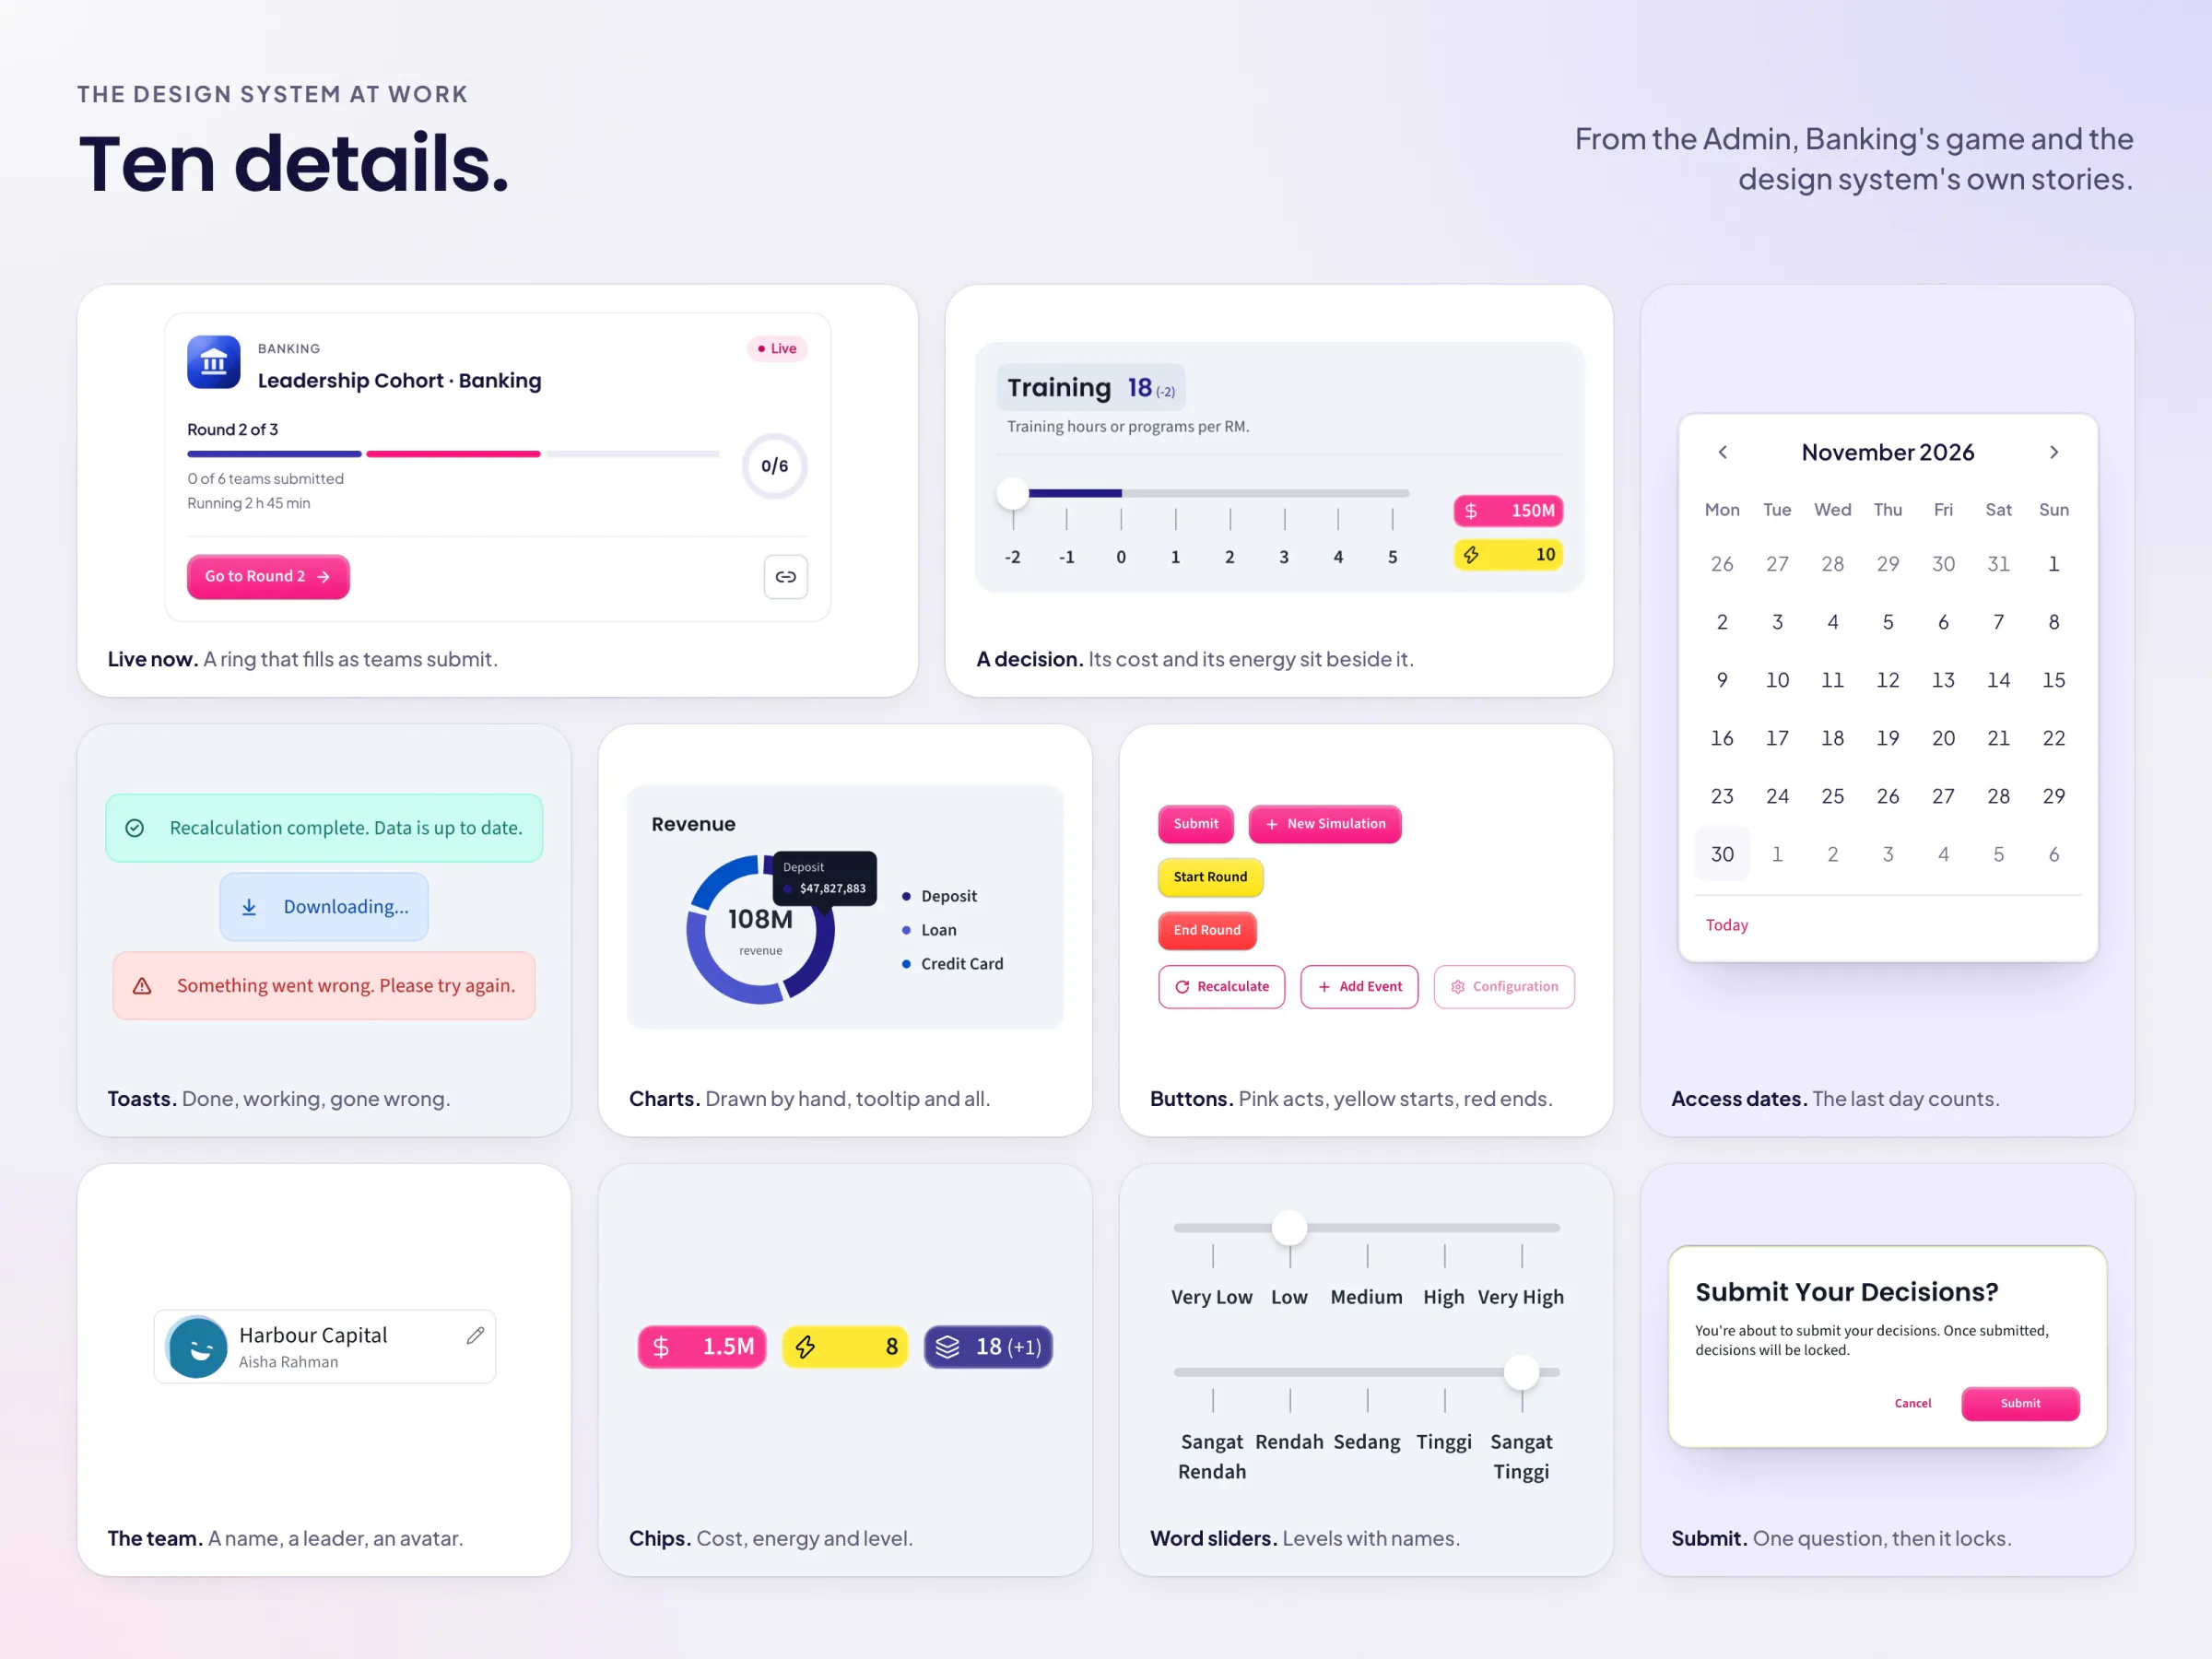
Ten small interface details in a grid, among them a live card, a decision slider, toasts, a chart, buttons and a submit dialog.
47Ten details
Storybook

The Design, Built as Components

The design was crafted by hand in Figma. AI coding sessions with Claude Code then built it as real components, and the result lives in Storybook: one workbench where every part can be opened, tried in its states and reused. Its 231 stories show the components at work, and 147 of them run an interaction test when they open. An accessibility violation fails a story's test, and components and stories cite the Figma node they were measured from.

The Admin is built entirely from these components, and the Banking and ET Prime players are moving onto them. For a developer, a new screen starts from parts that already exist and already match the design.
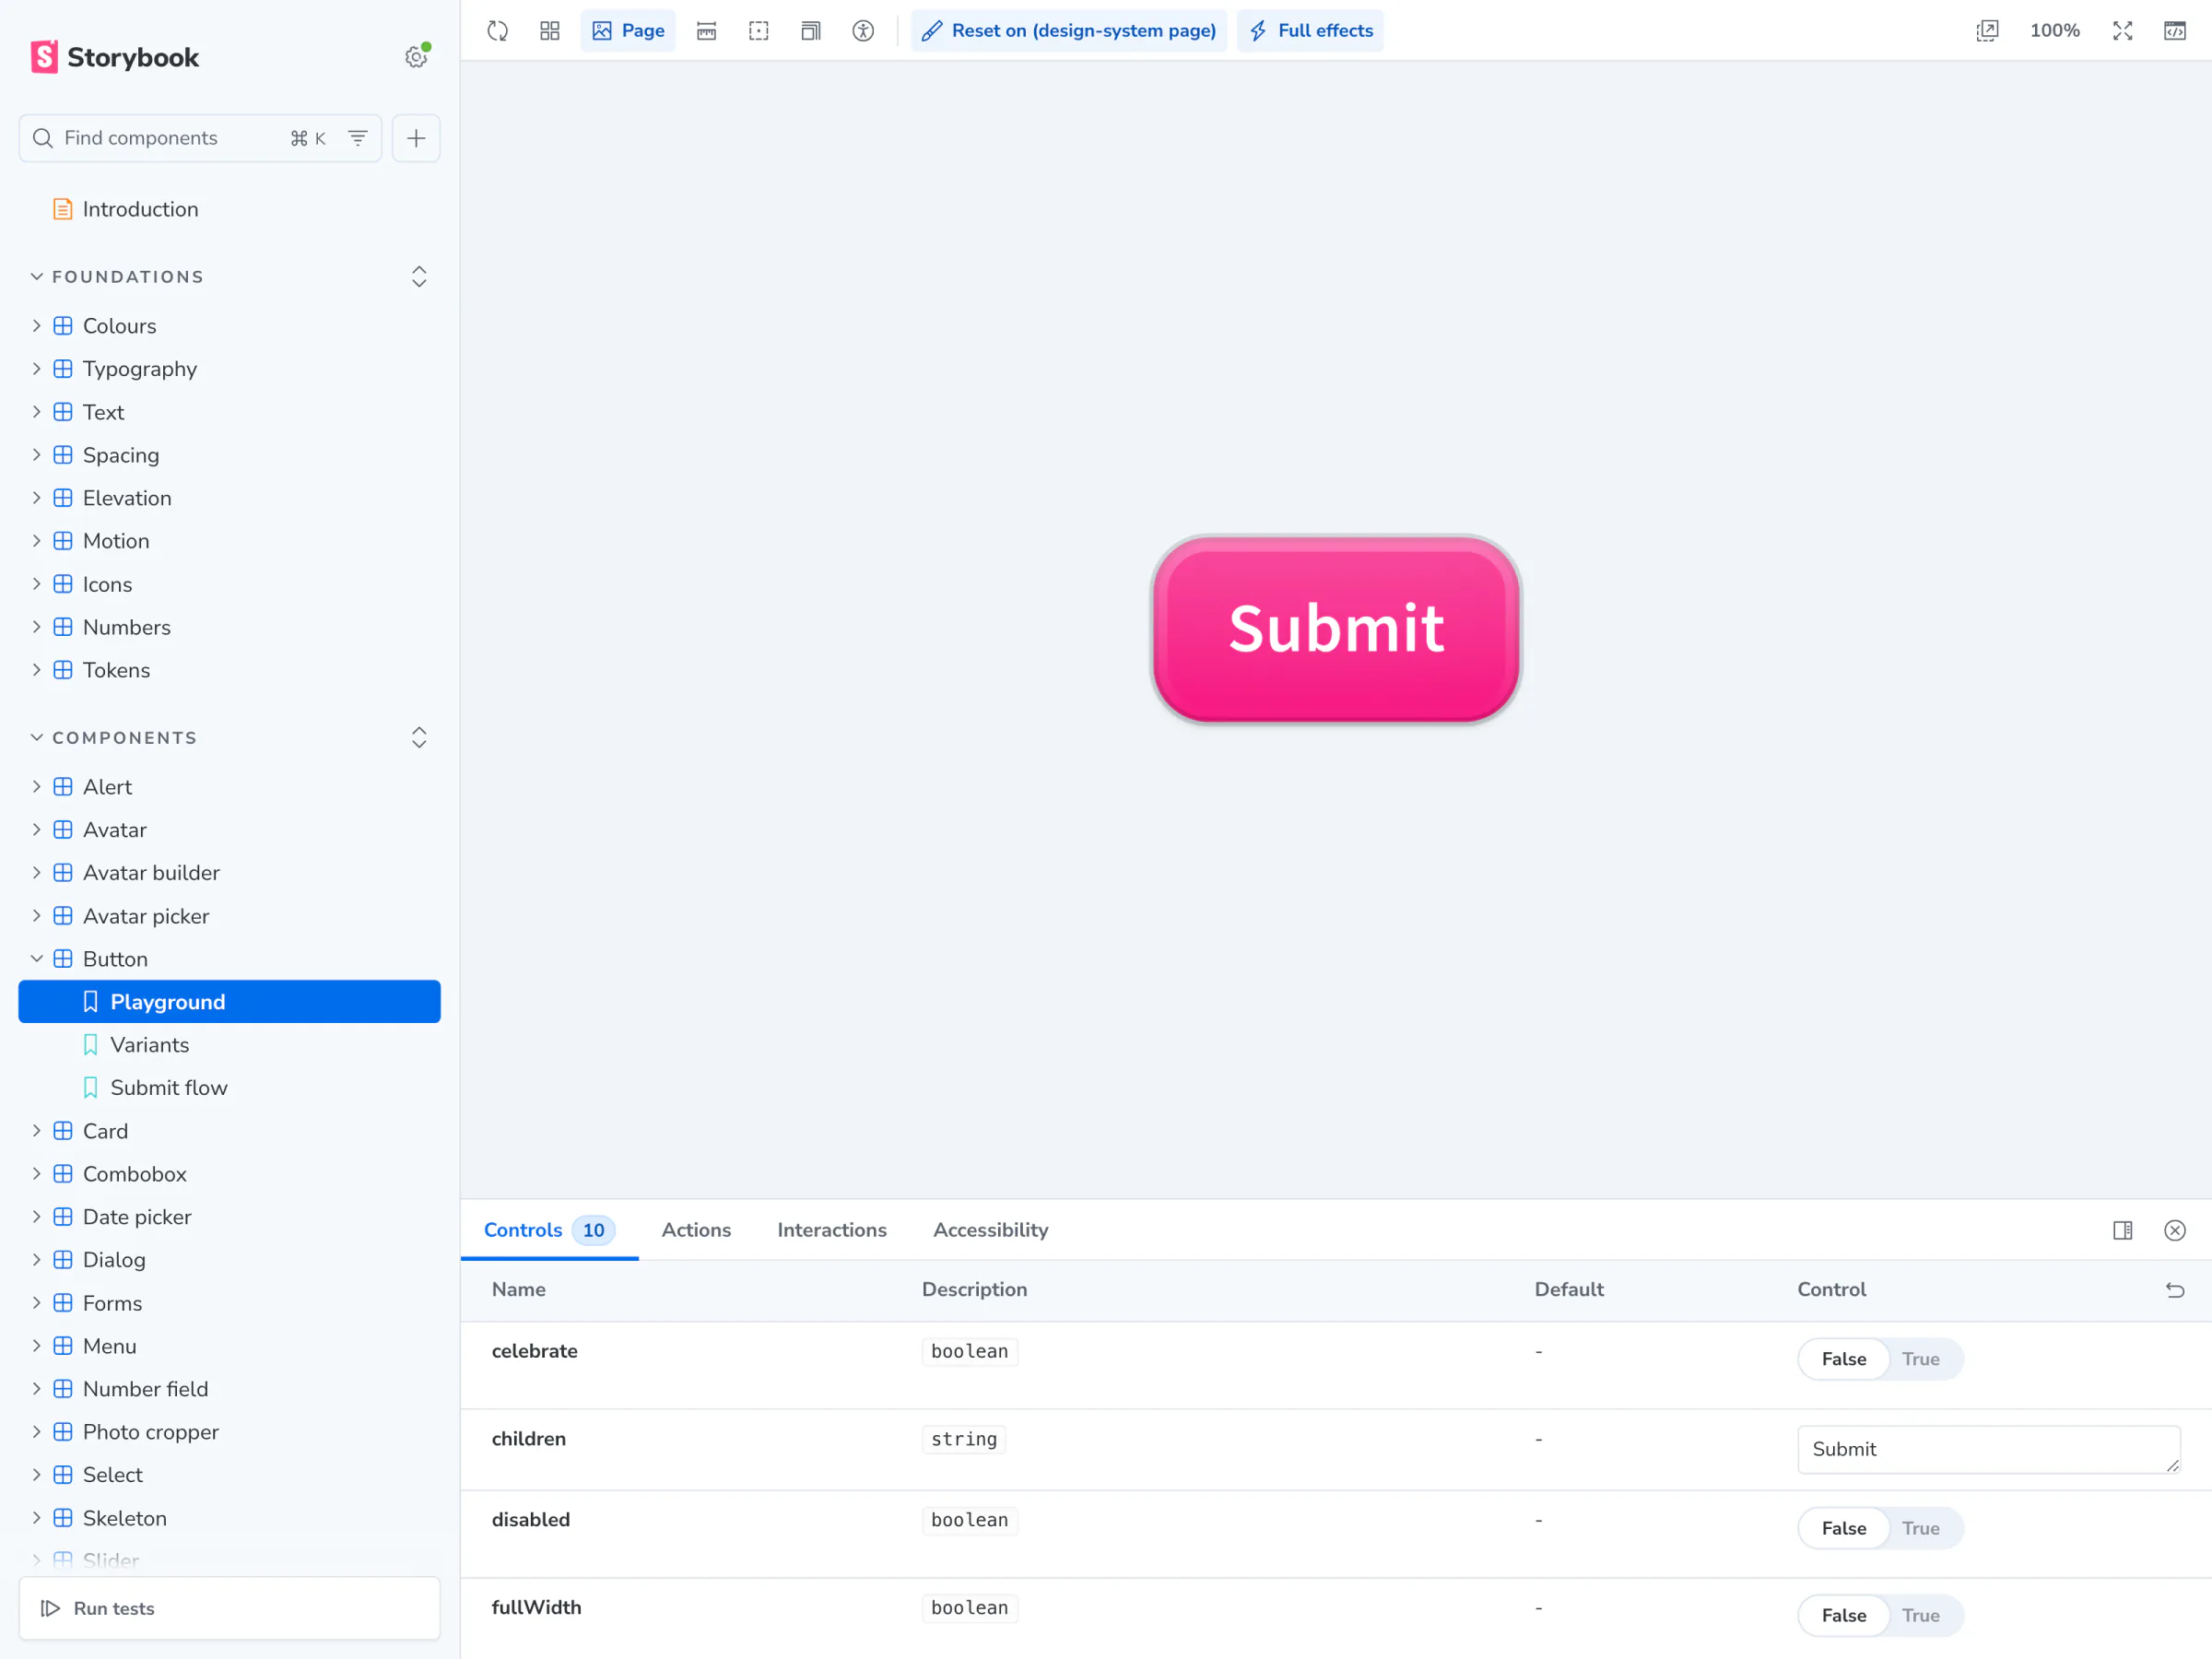
48 · VideoThe design system in its Storybook
Storybook's own window: the component tree on the left, a button in the middle, and its Controls panel below.
49Every component can be tried with its controls
Storybook's window showing a decisions story with the Interactions panel below it, marked as passed.
50An interaction test runs when its story opens
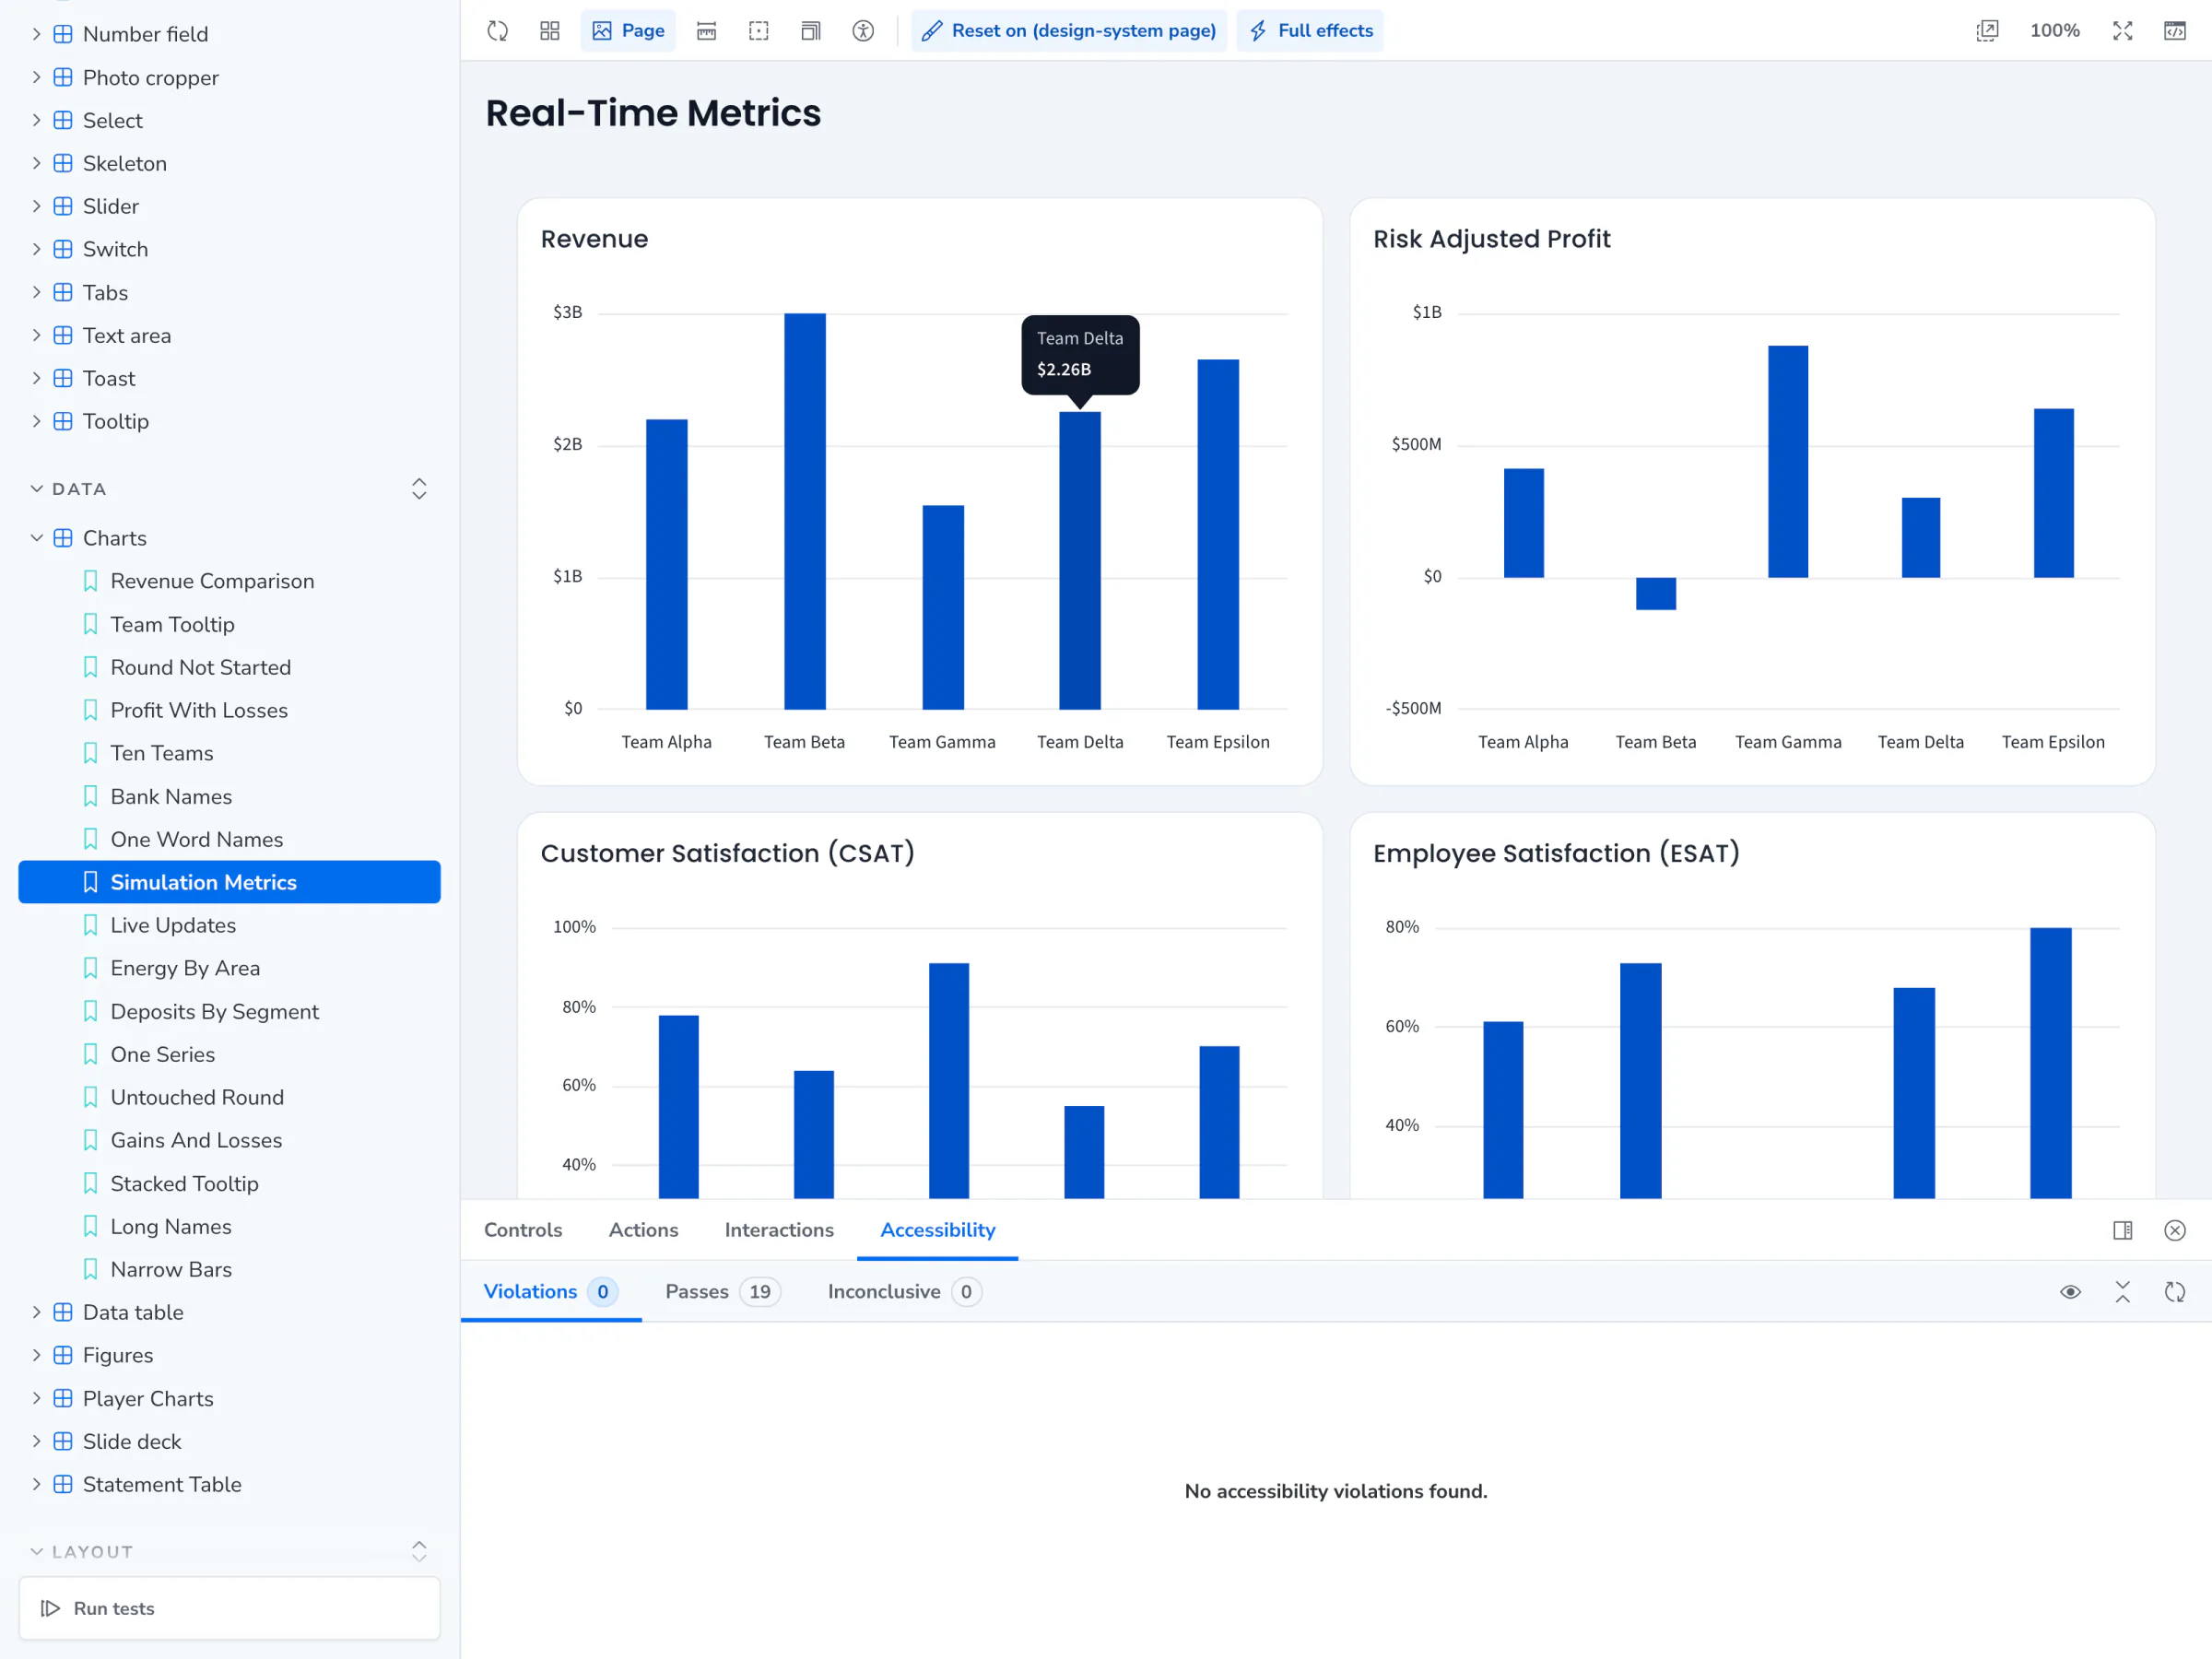
Storybook's window showing chart cards with the Accessibility panel below: no violations found.
51An accessibility violation fails the story
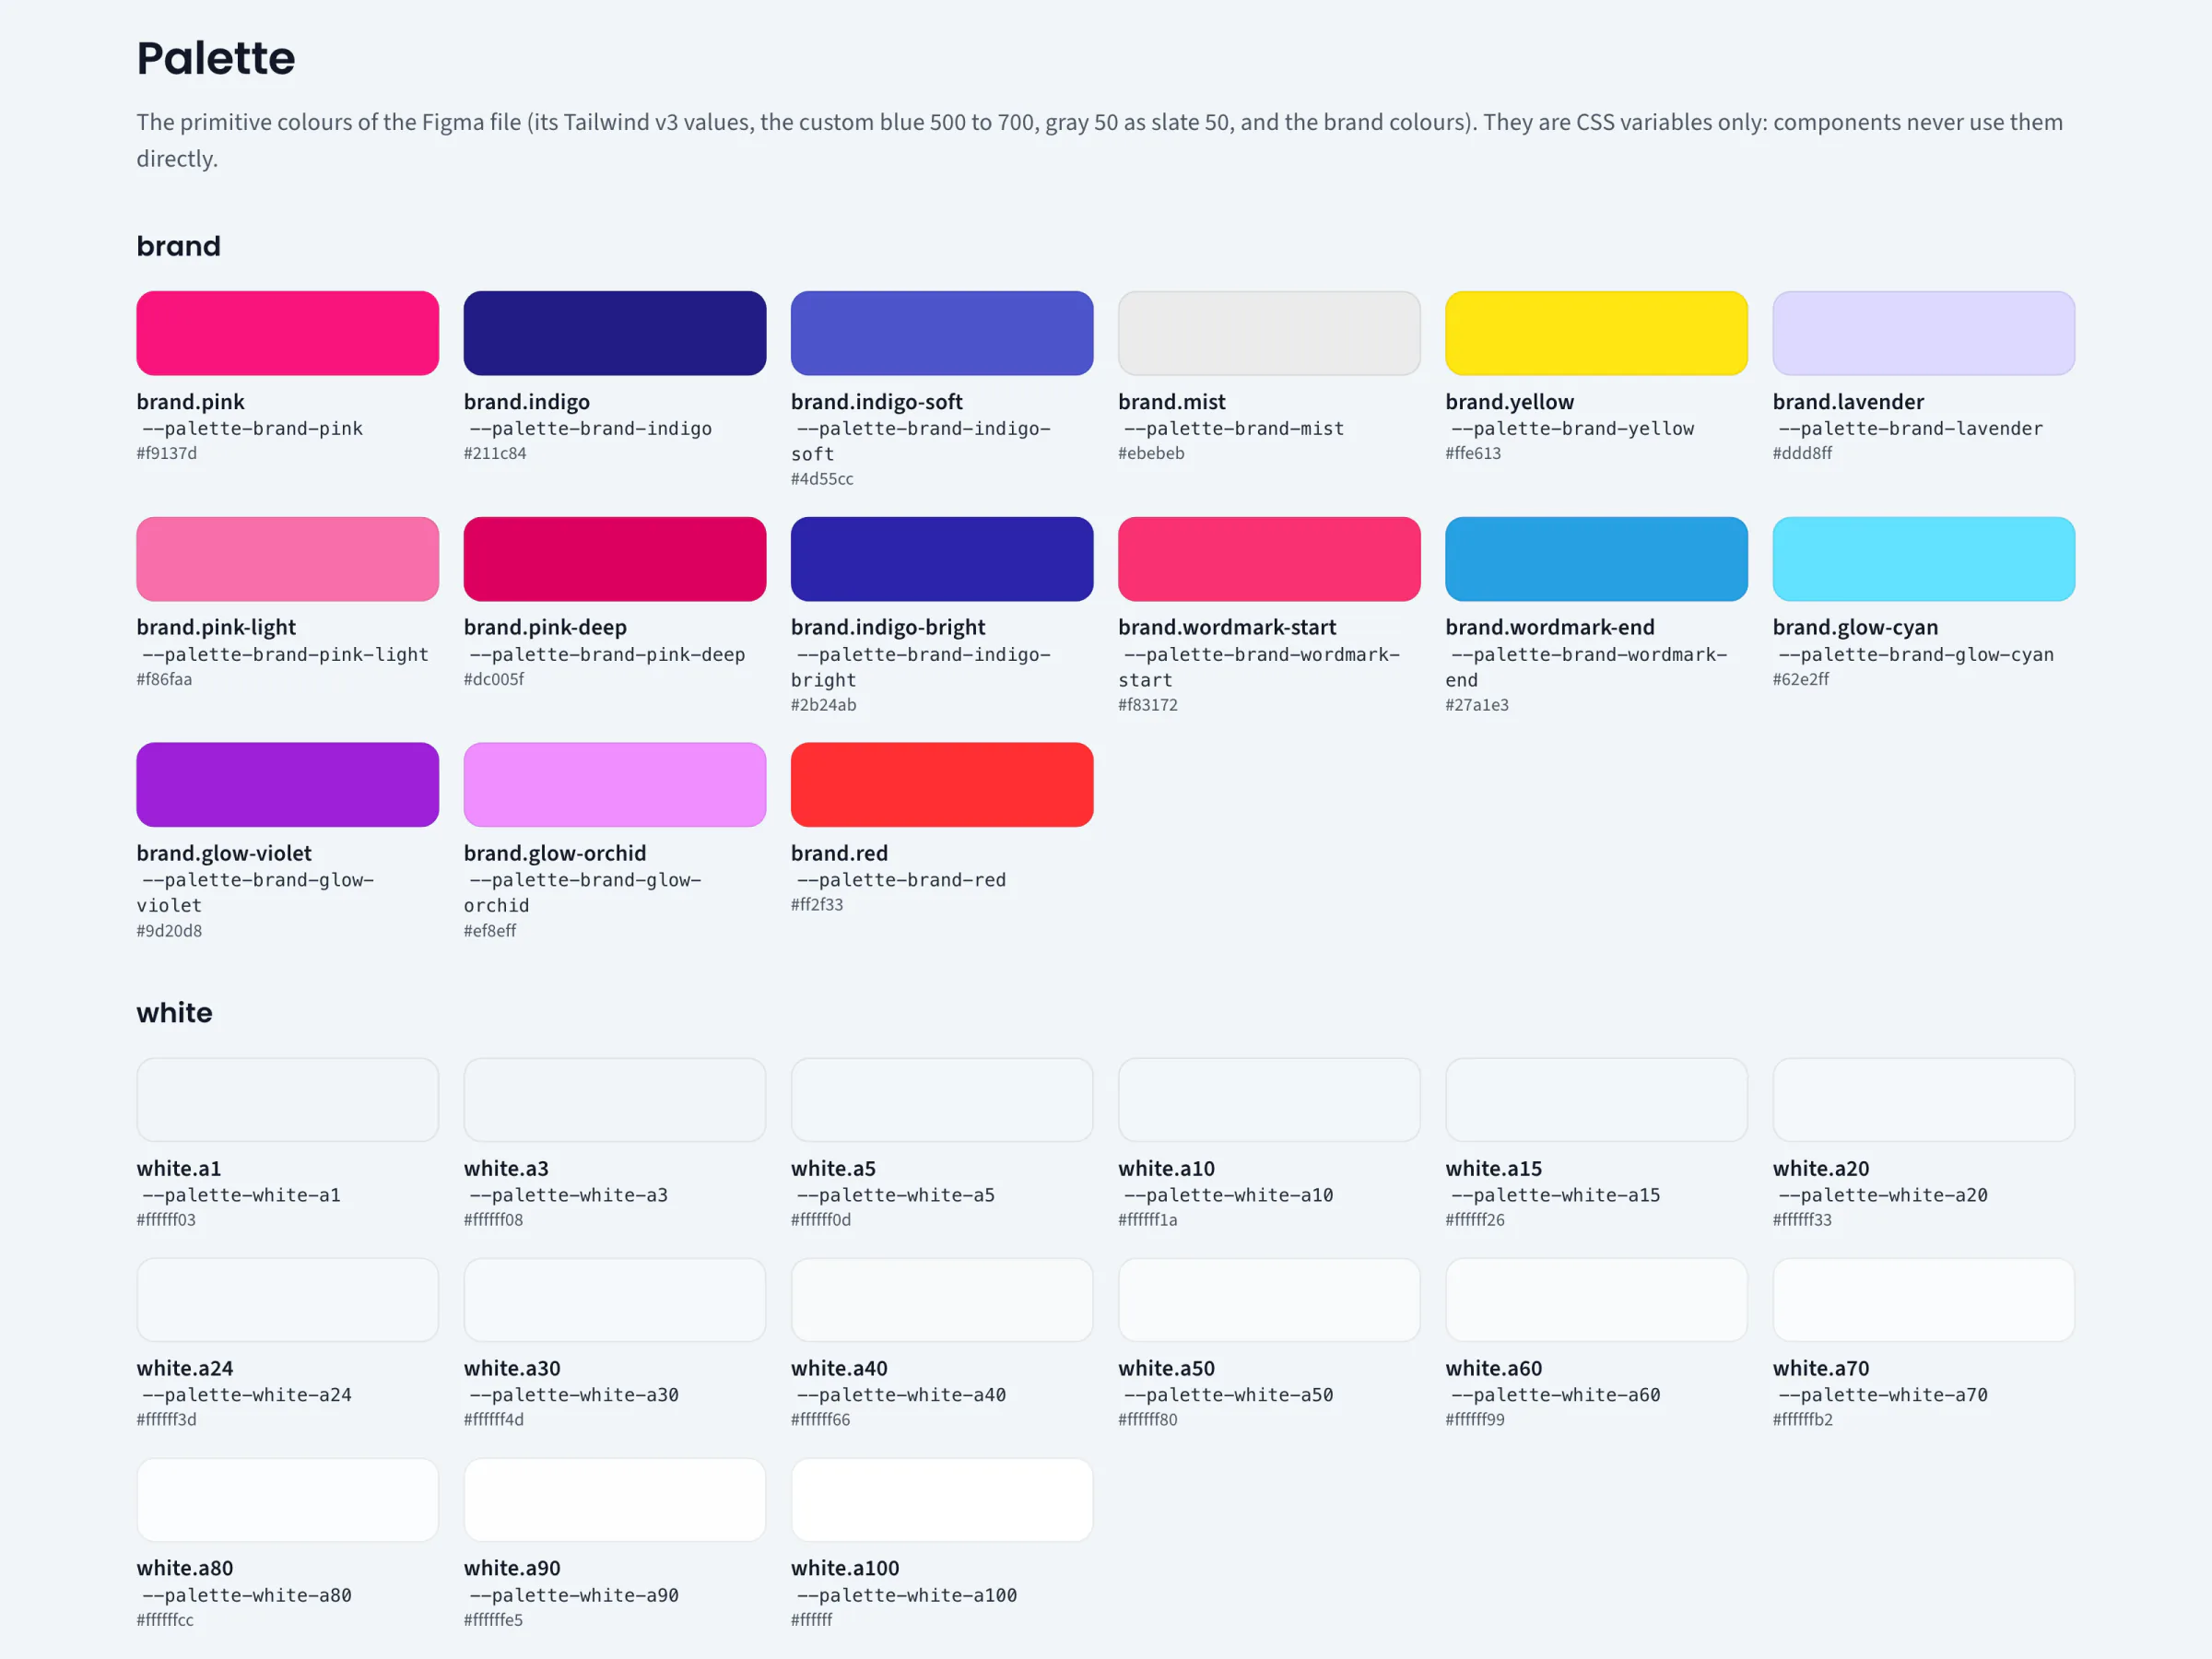
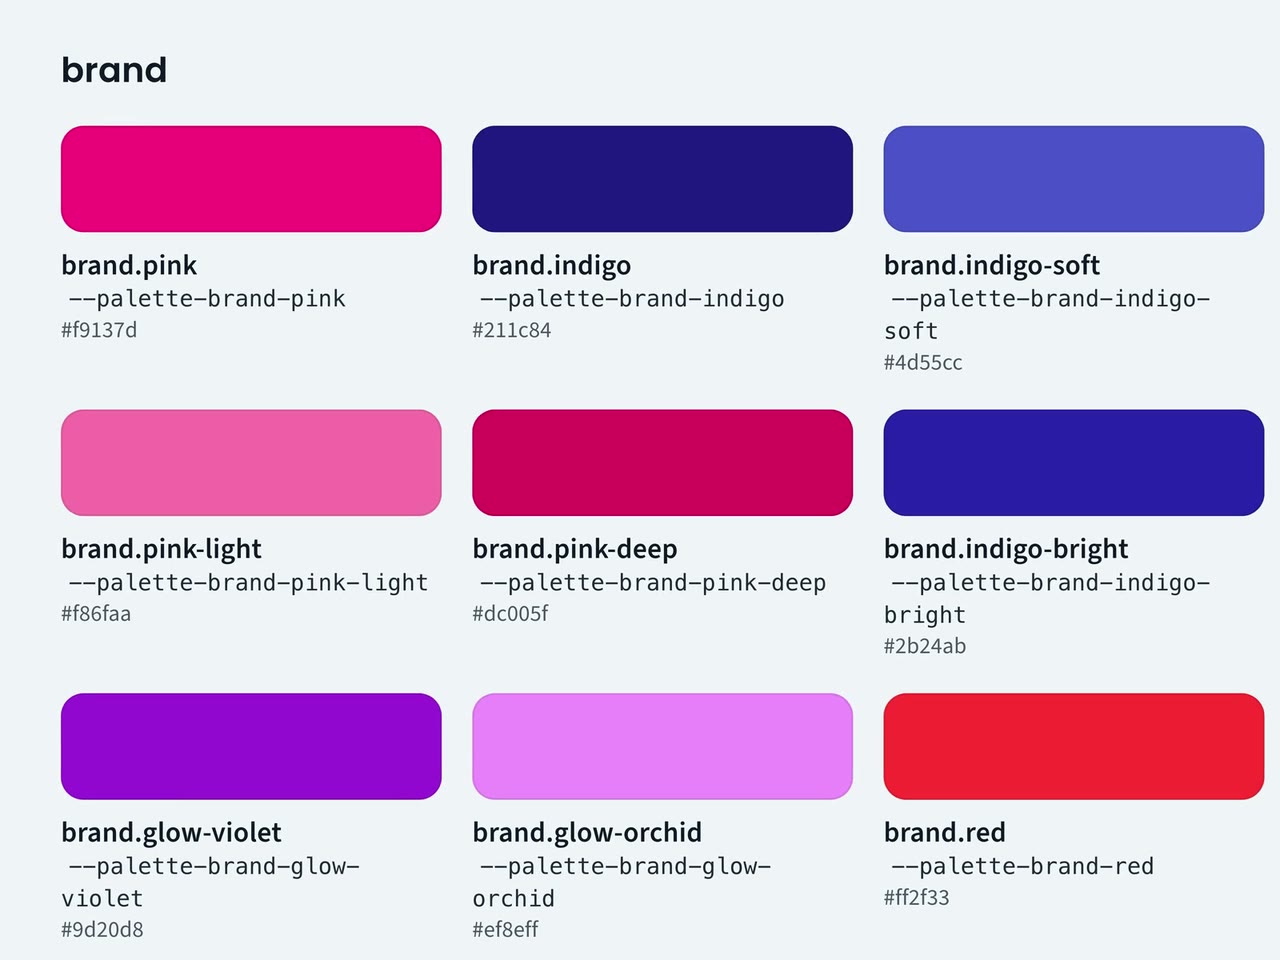
A Storybook page titled Palette: brand colour swatches with token names, pink, indigo, mist, yellow and lavender among them.
52The brand colours, each with its token name
A Typography page: text roles shown as samples, from the wordmark to headings, each with its font, size and weight.
53The text roles
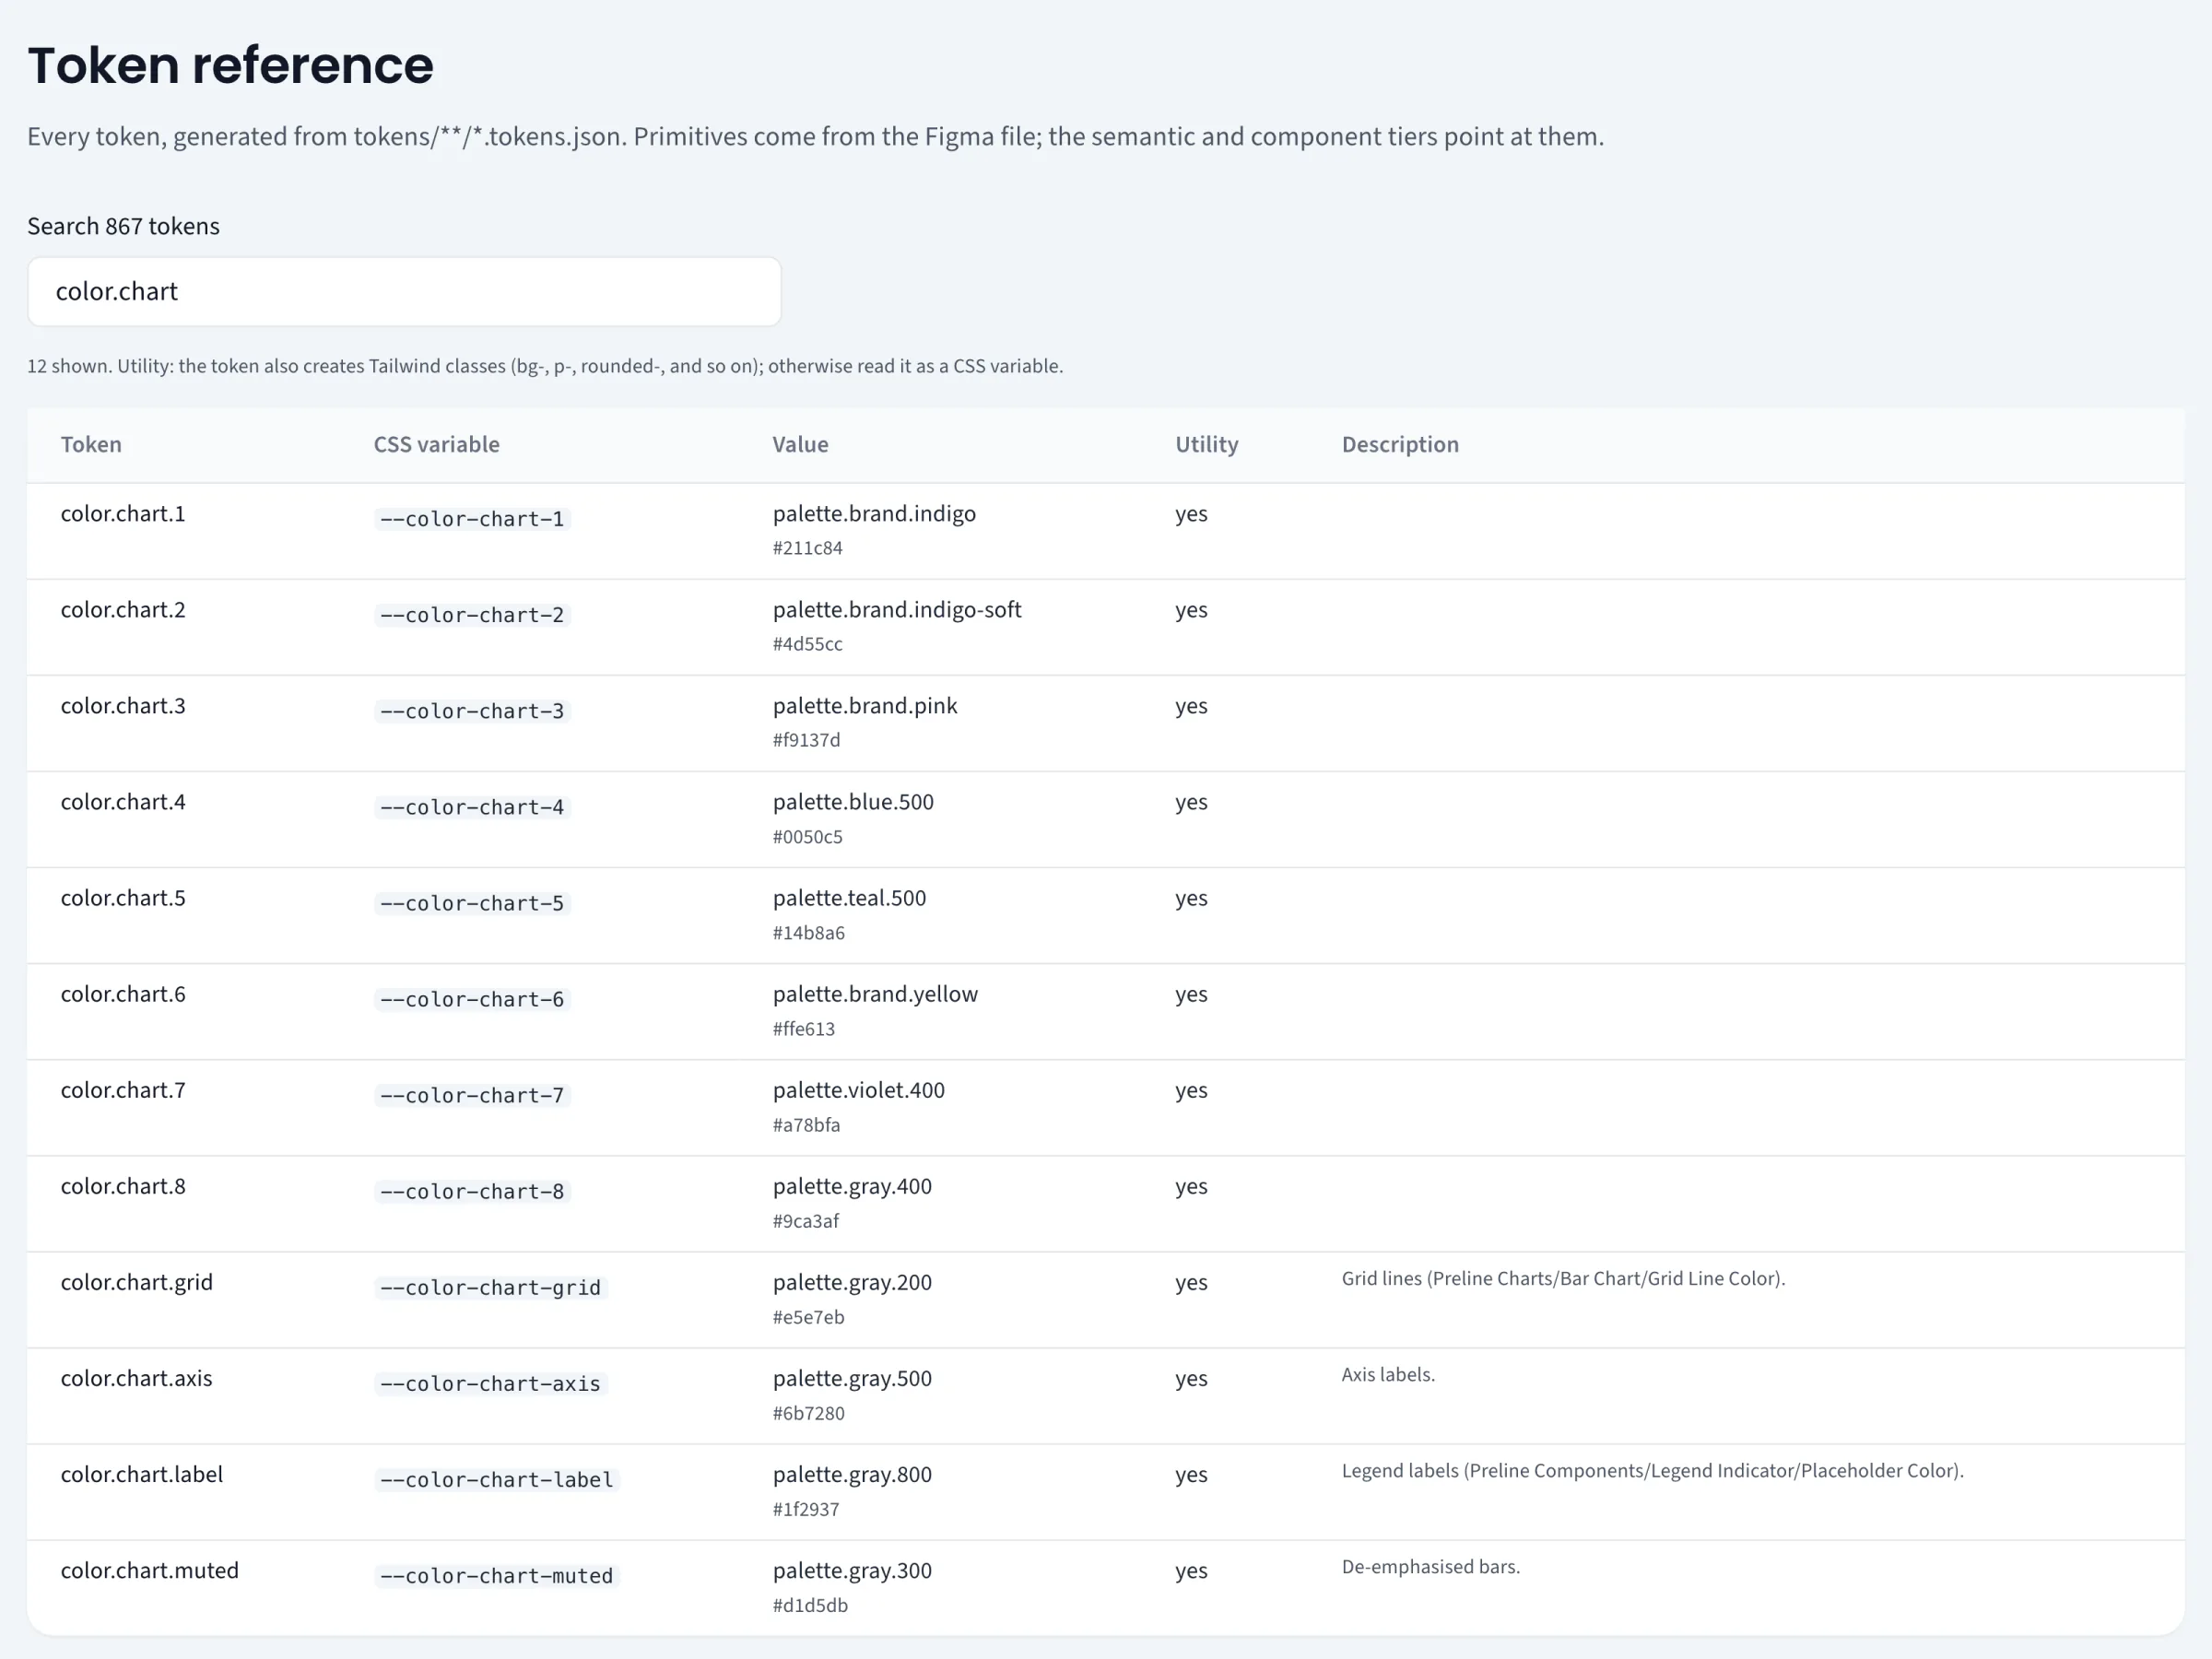
A Token reference page with a search field reading "Search 867 tokens", filtered to chart colours: 12 shown.
54Every token can be searched
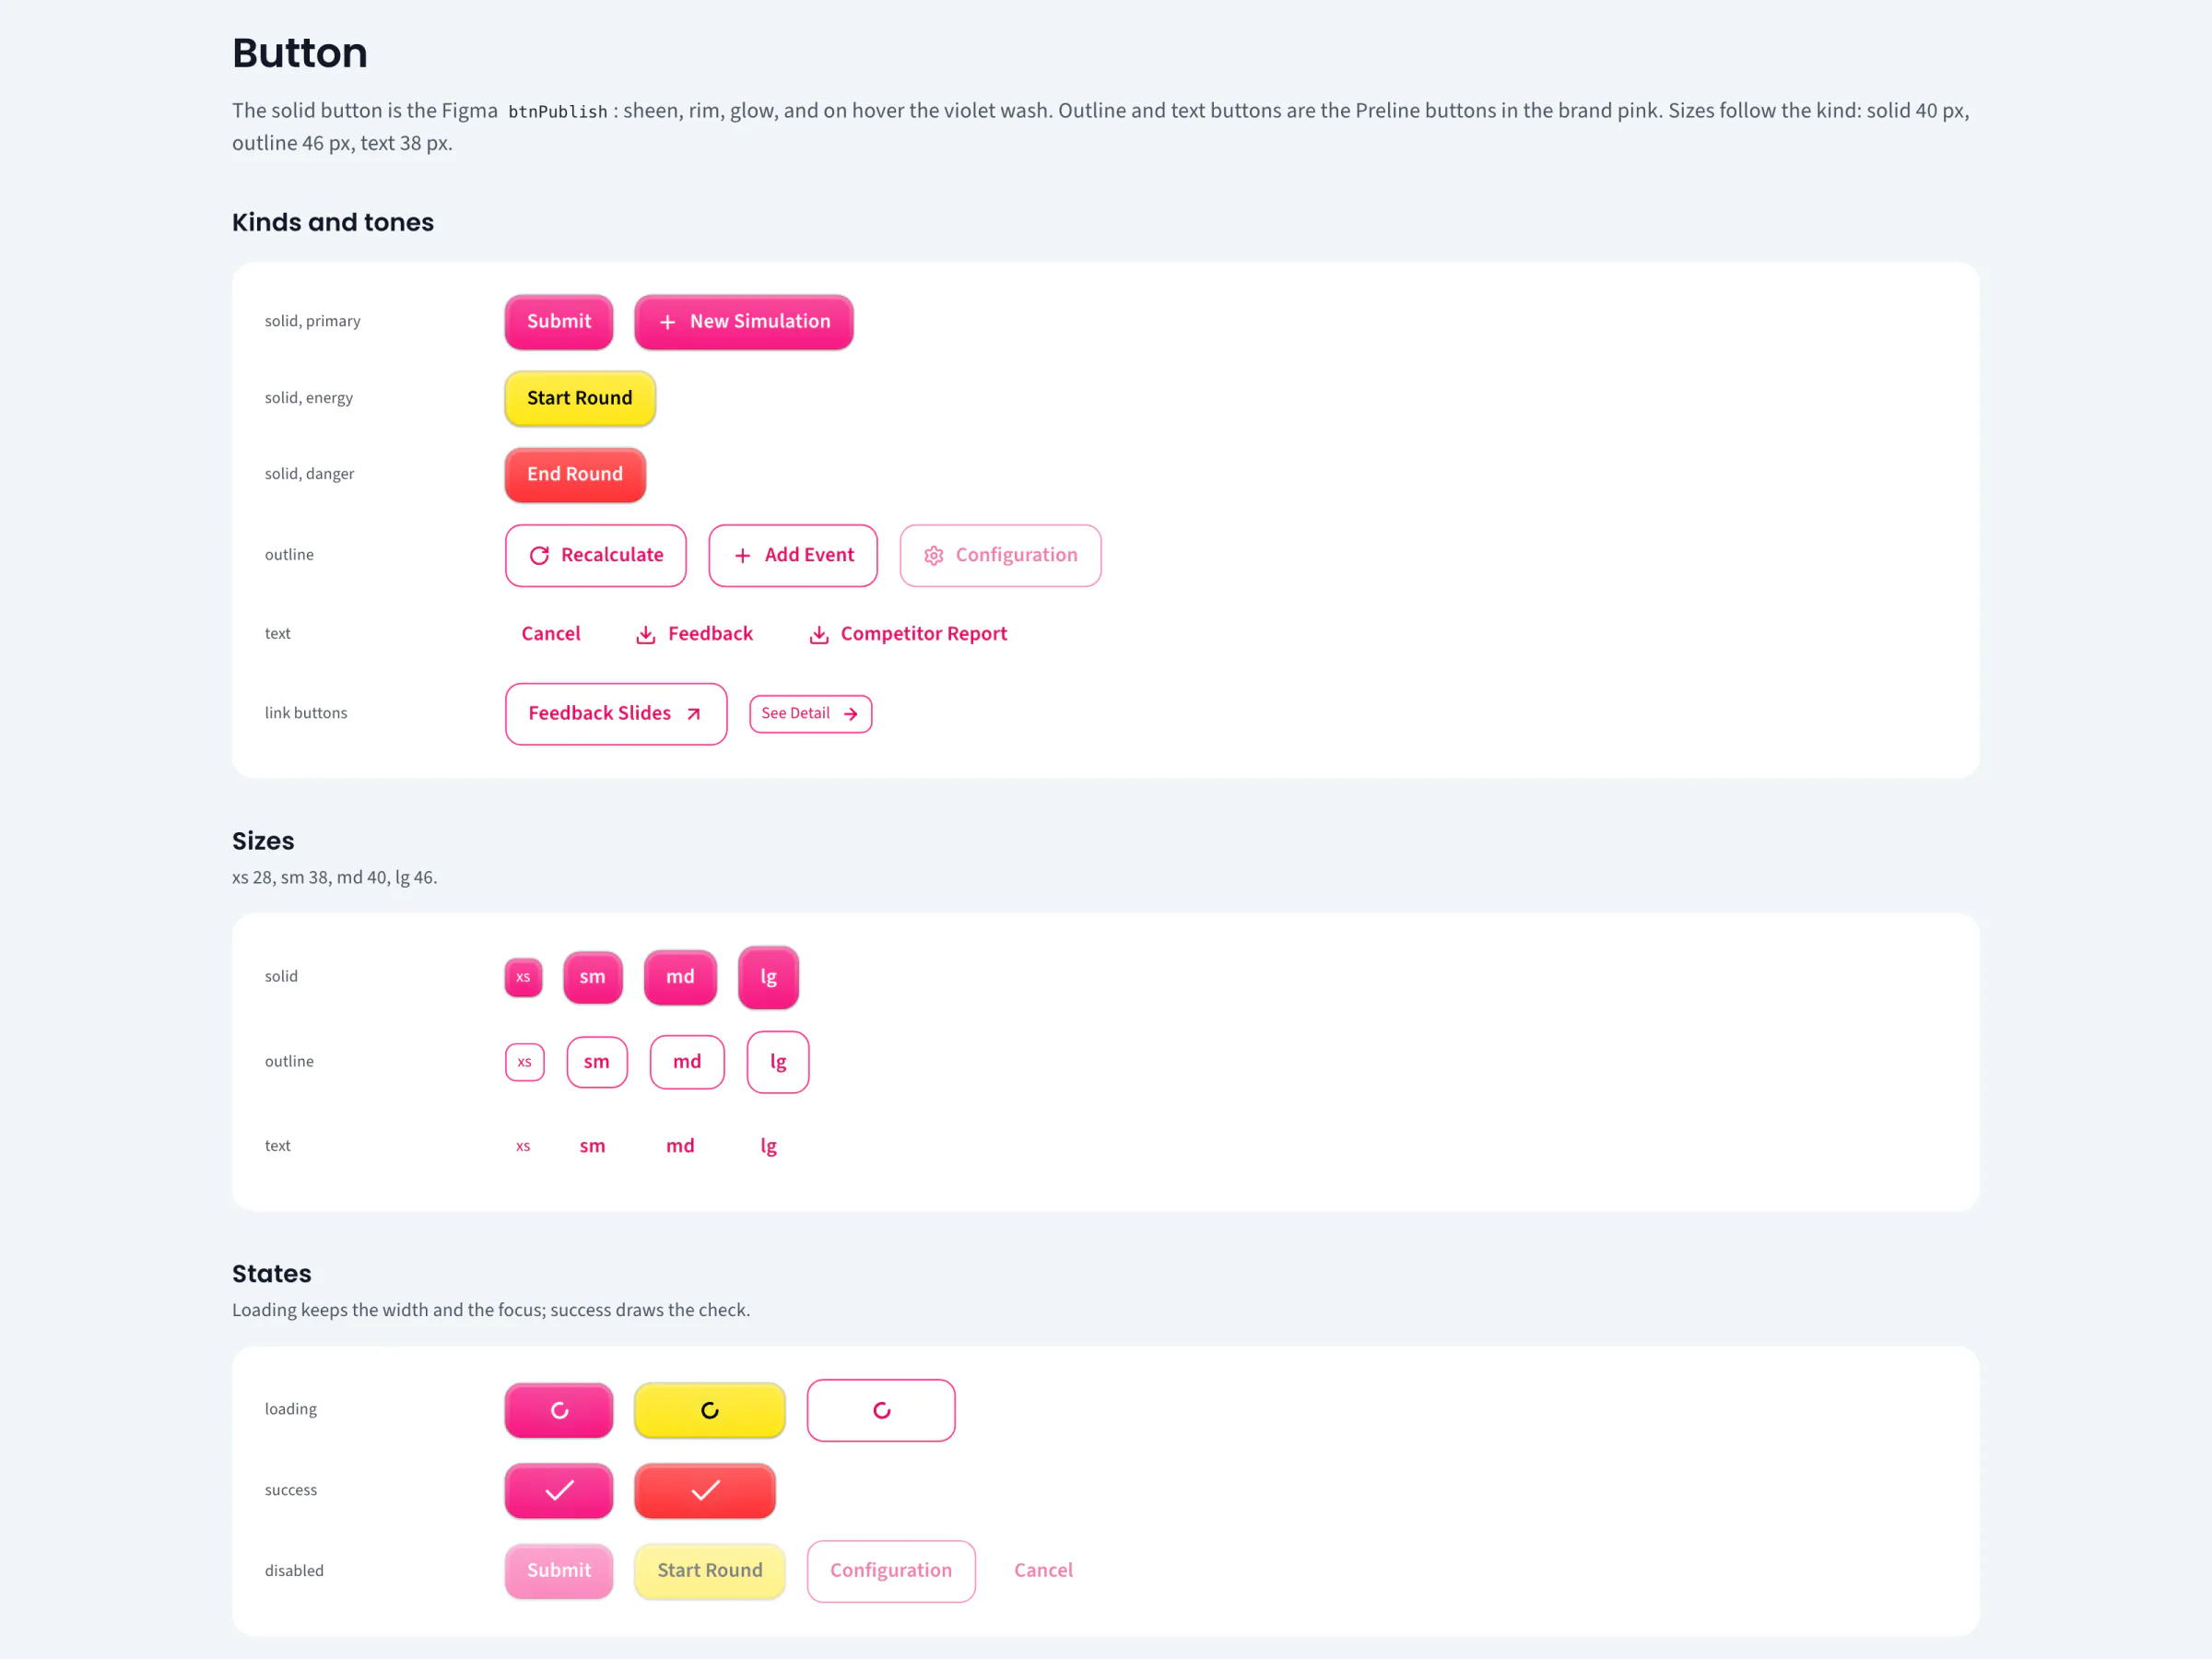
A Button page: solid, outline, text and link buttons in each tone, then sizes and states.
55Buttons: kinds, tones, sizes
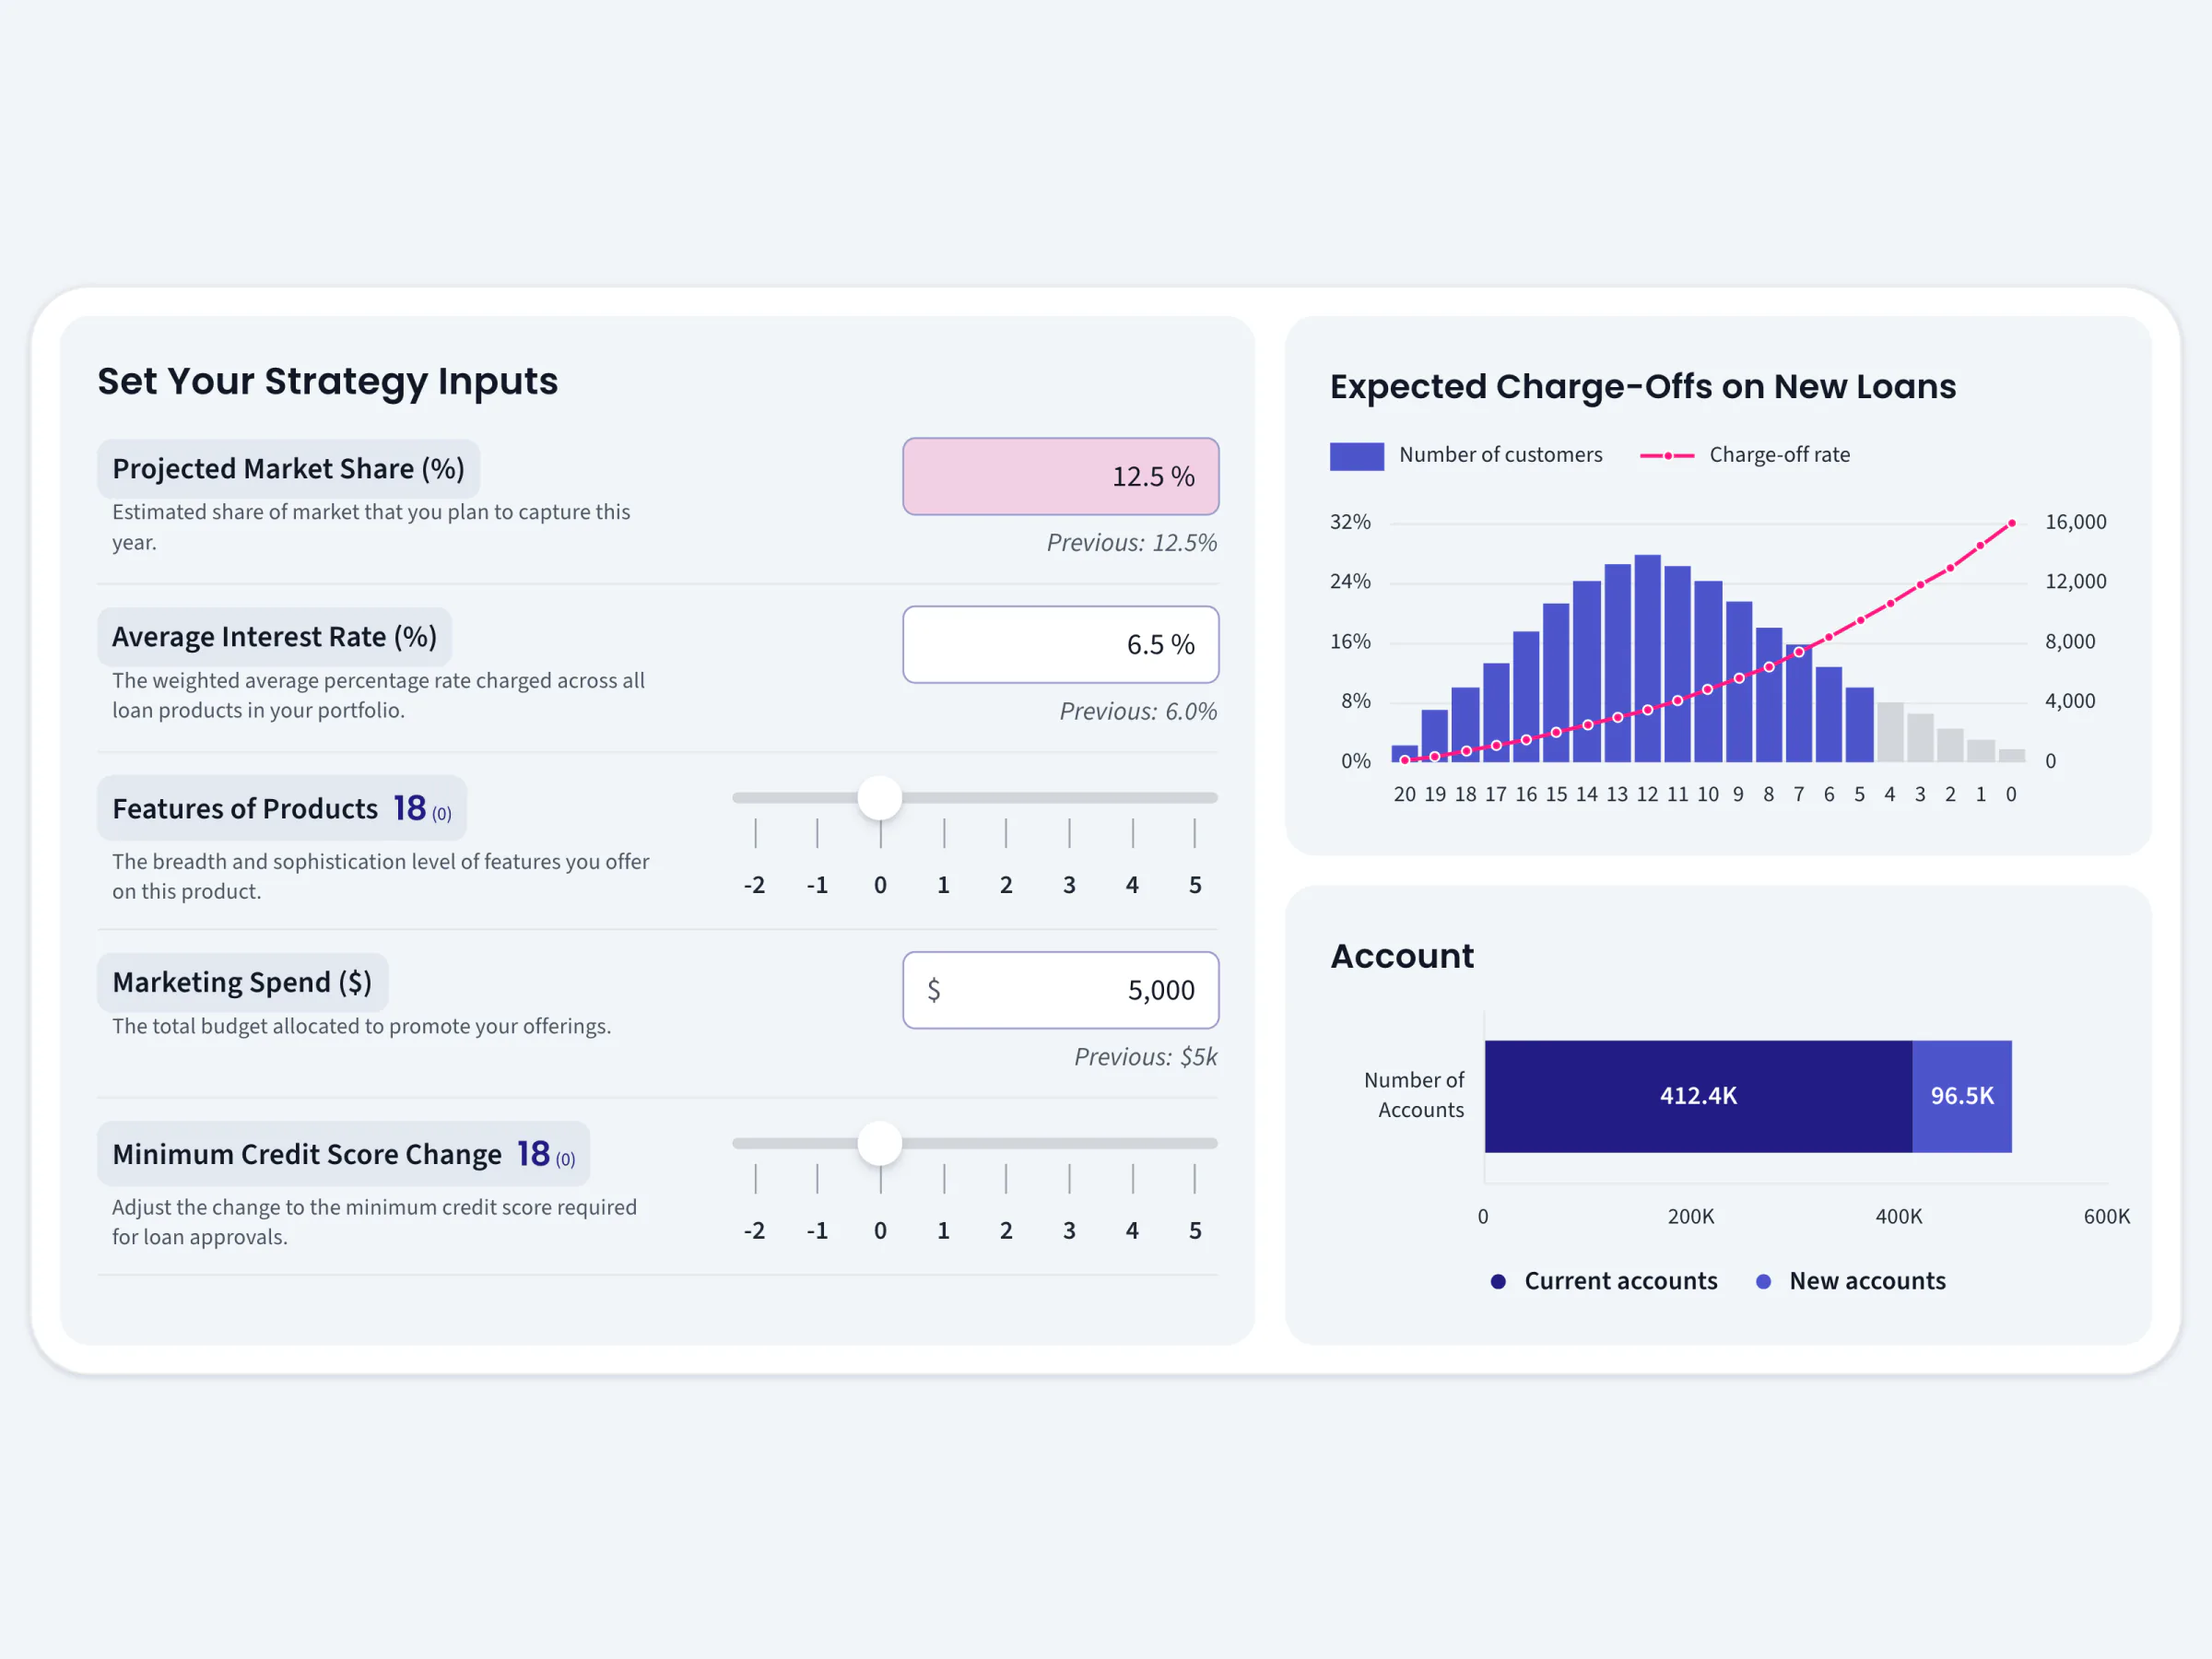
A strategy inputs panel beside a charge-offs chart and an account chart.
56Game parts: decisions beside their charts
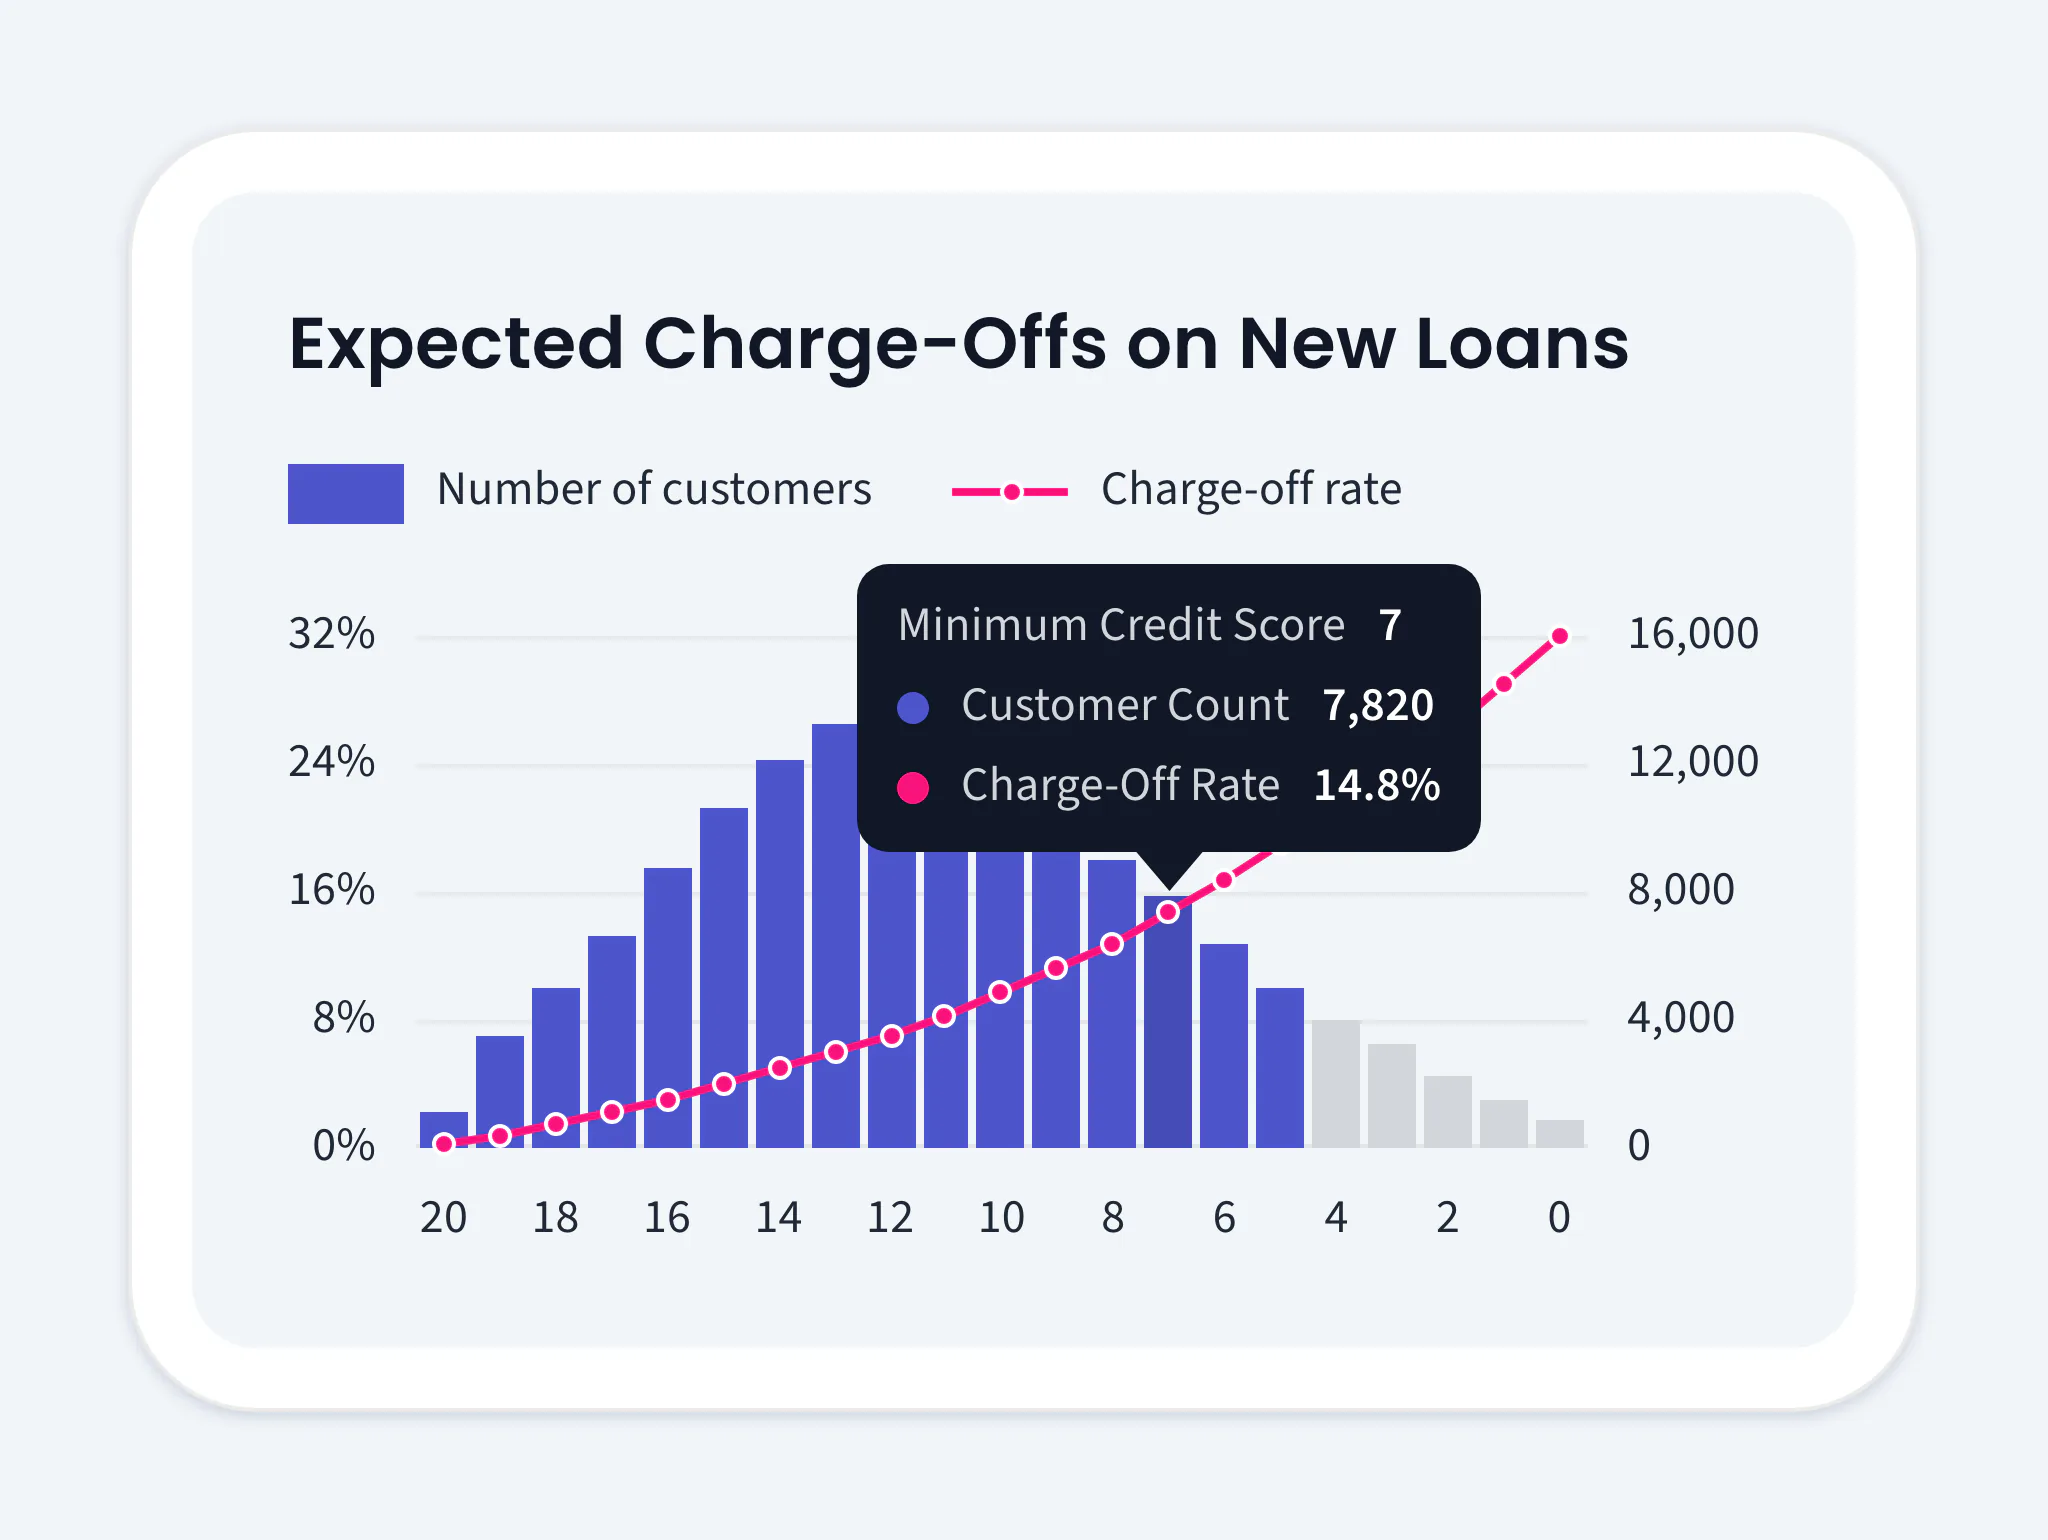
A chart of expected charge-offs on new loans: bars and a rate line, with a tooltip reading a 14.8% charge-off rate.
57A chart drawn by hand, with its tooltip
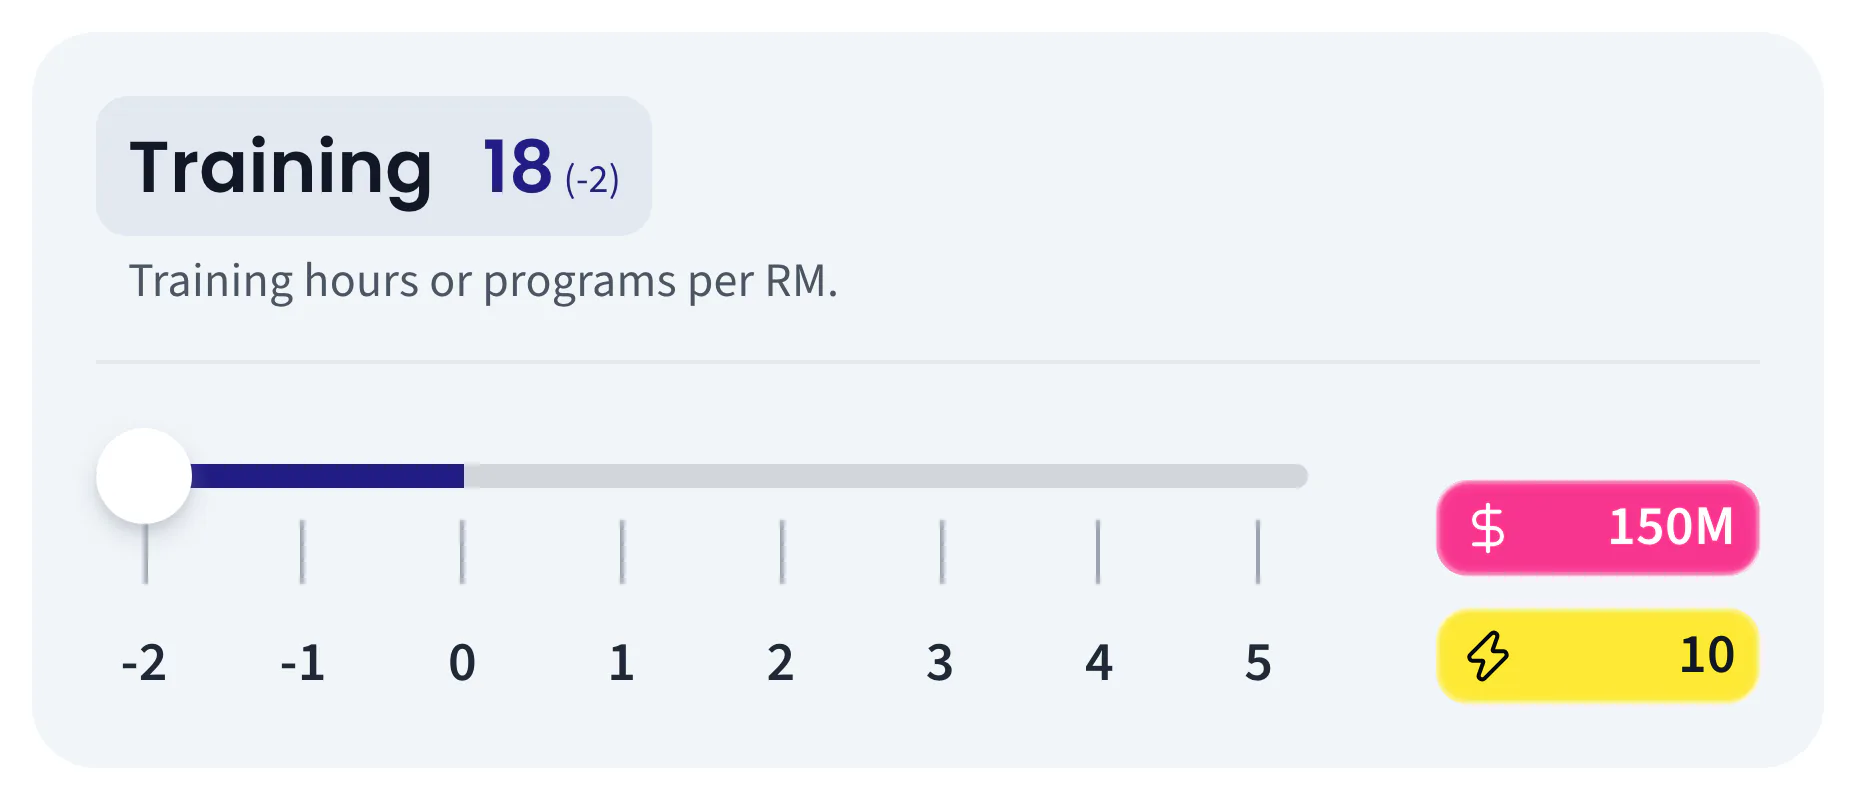
One decision tile, Training: a slider at 18, down 2, with a $150M cost chip and an energy chip of 10.
58One decision tile
08

Directing AI Sessions in Parallel

The design was crafted by hand in Figma, and the building was done by AI coding sessions. After a discovery session with twelve research agents, three sessions worked in parallel, each in its own worktree and owning its own folders. They coordinated through a log, a requests file and handover notes, and met at written contracts with tests. Hooks enforced my standing rules. I directed, decided, reviewed screens and approved merges. I also overrode: a wholesale player restyle and a dark Admin were both stopped at first look. The record keeps the slips too, such as a demo reset 32 minutes after a public link opened.

  • 460 commits from import to last merge, in 5 days and 17 hours.
  • Every check during the build was local: CI ran nothing from 24 September 2026.
  • The recorded slips and overrides are part of the story, not hidden.
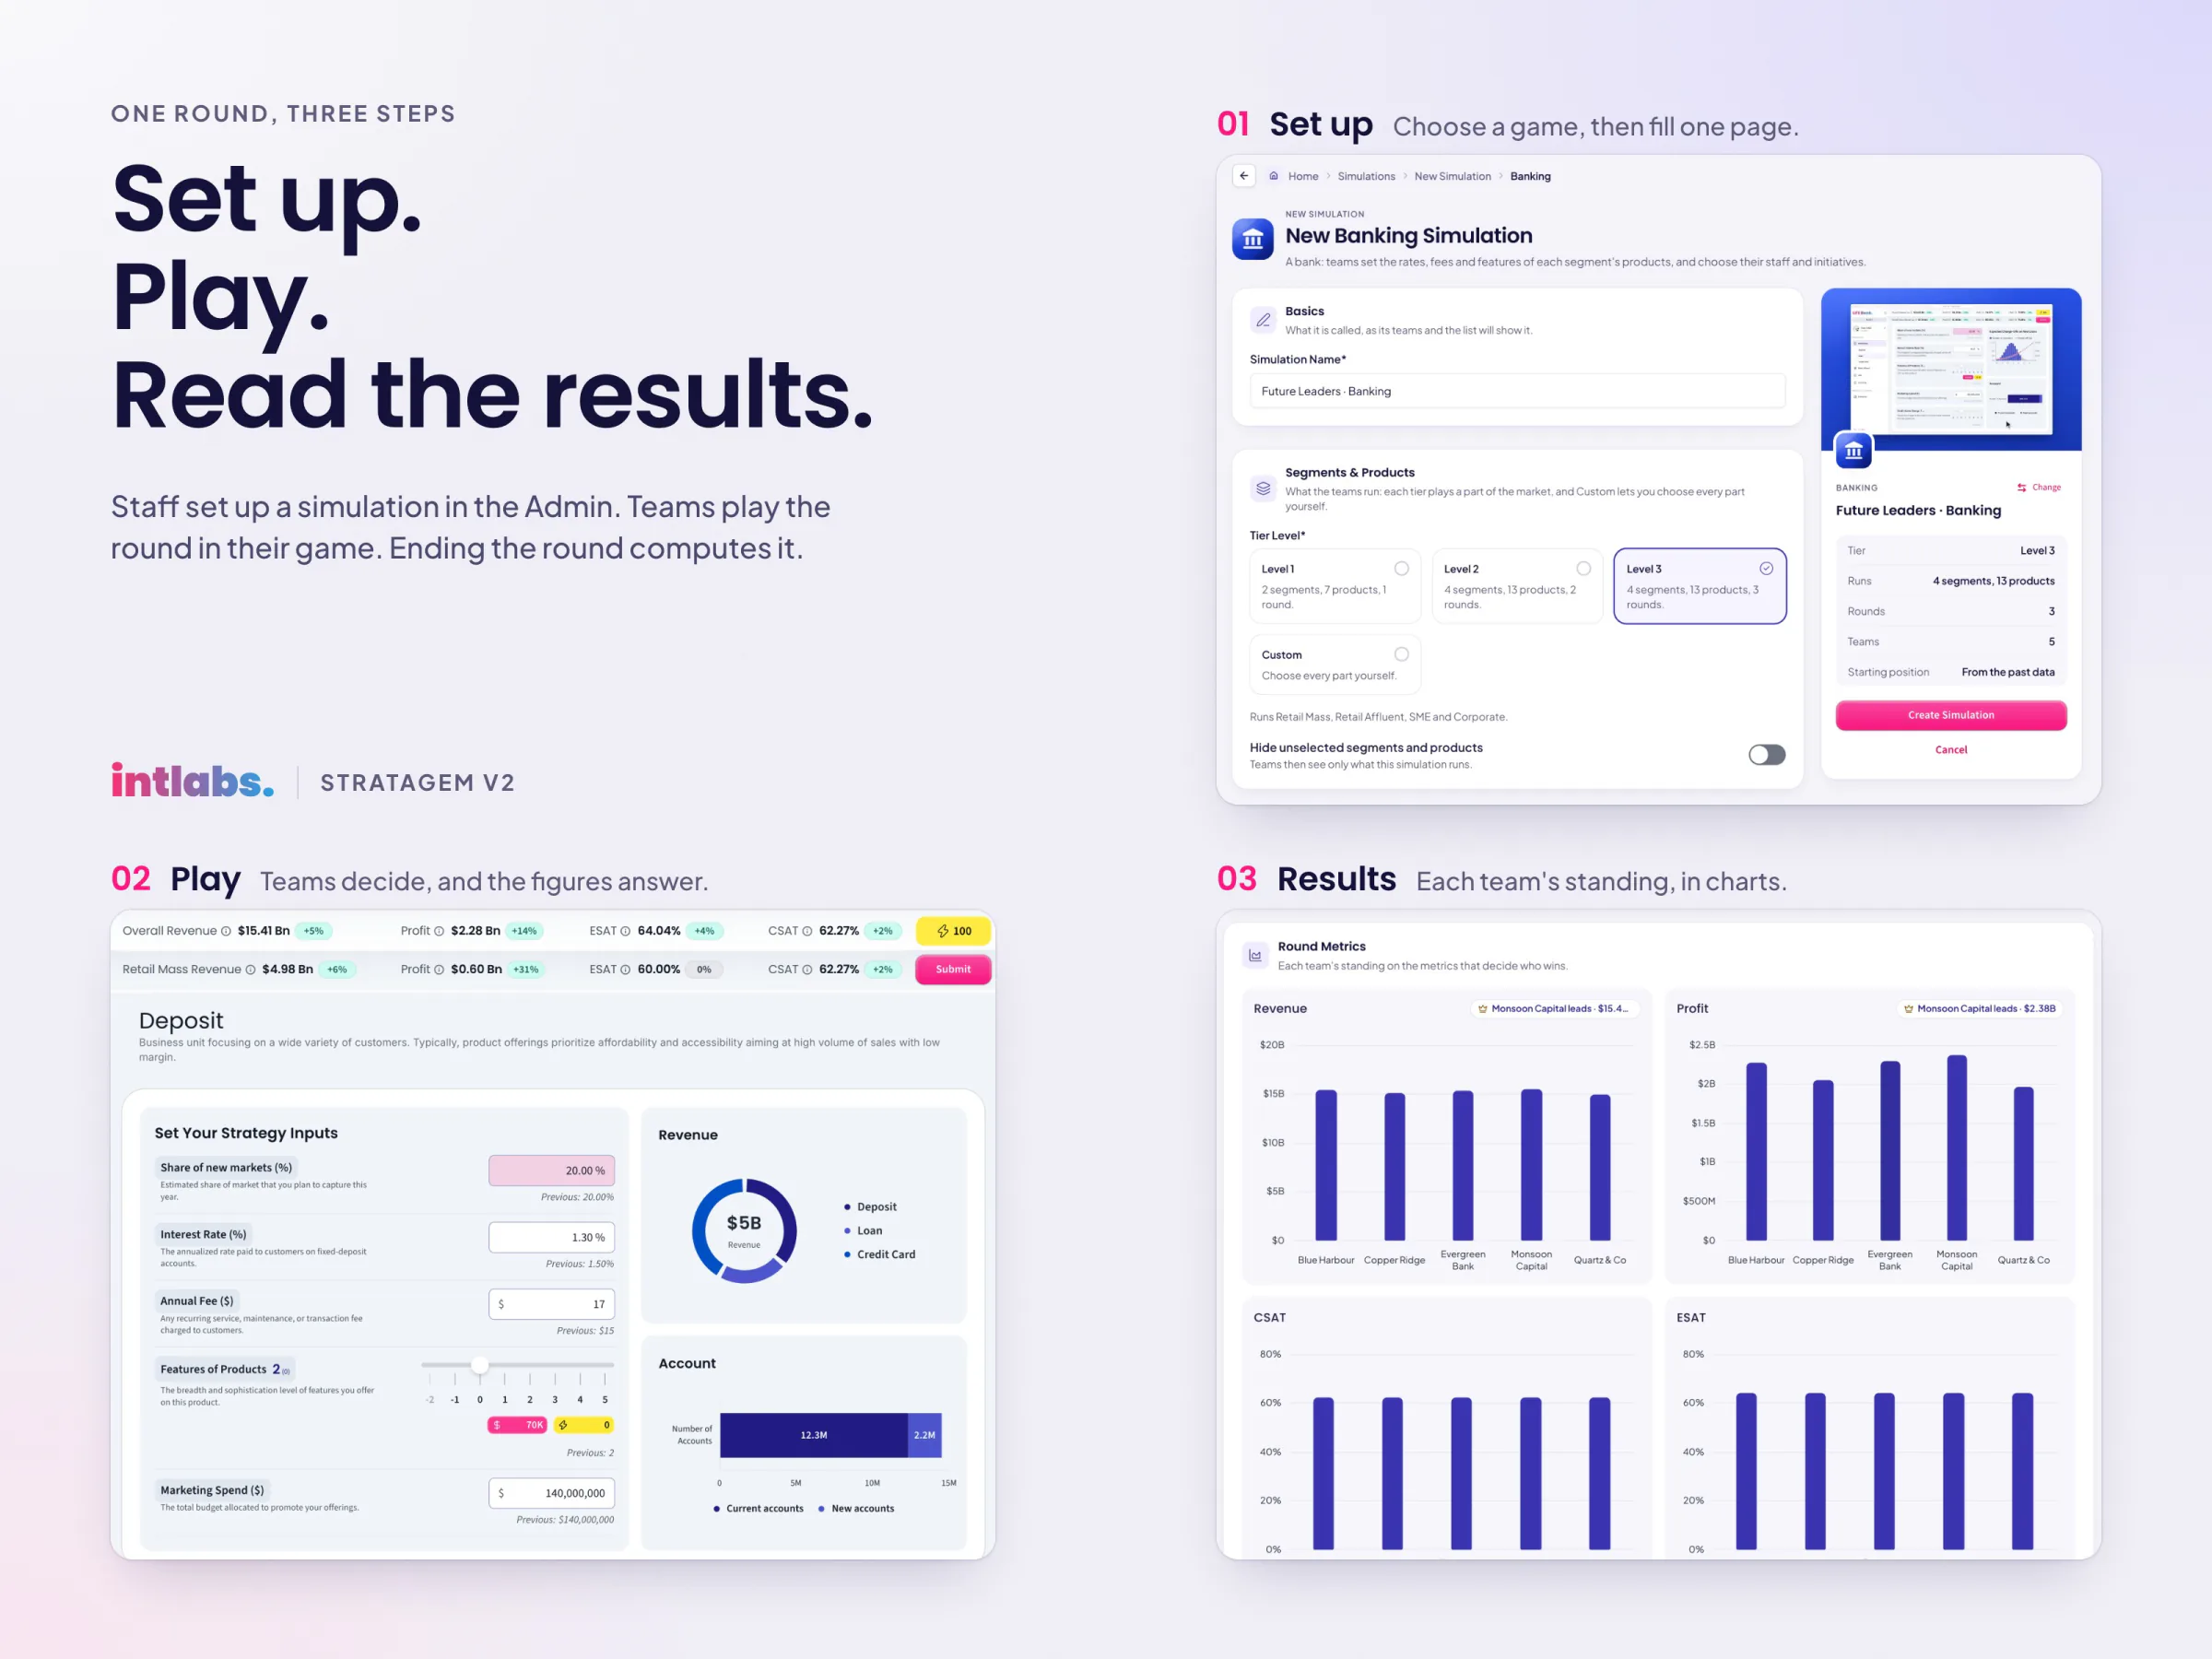
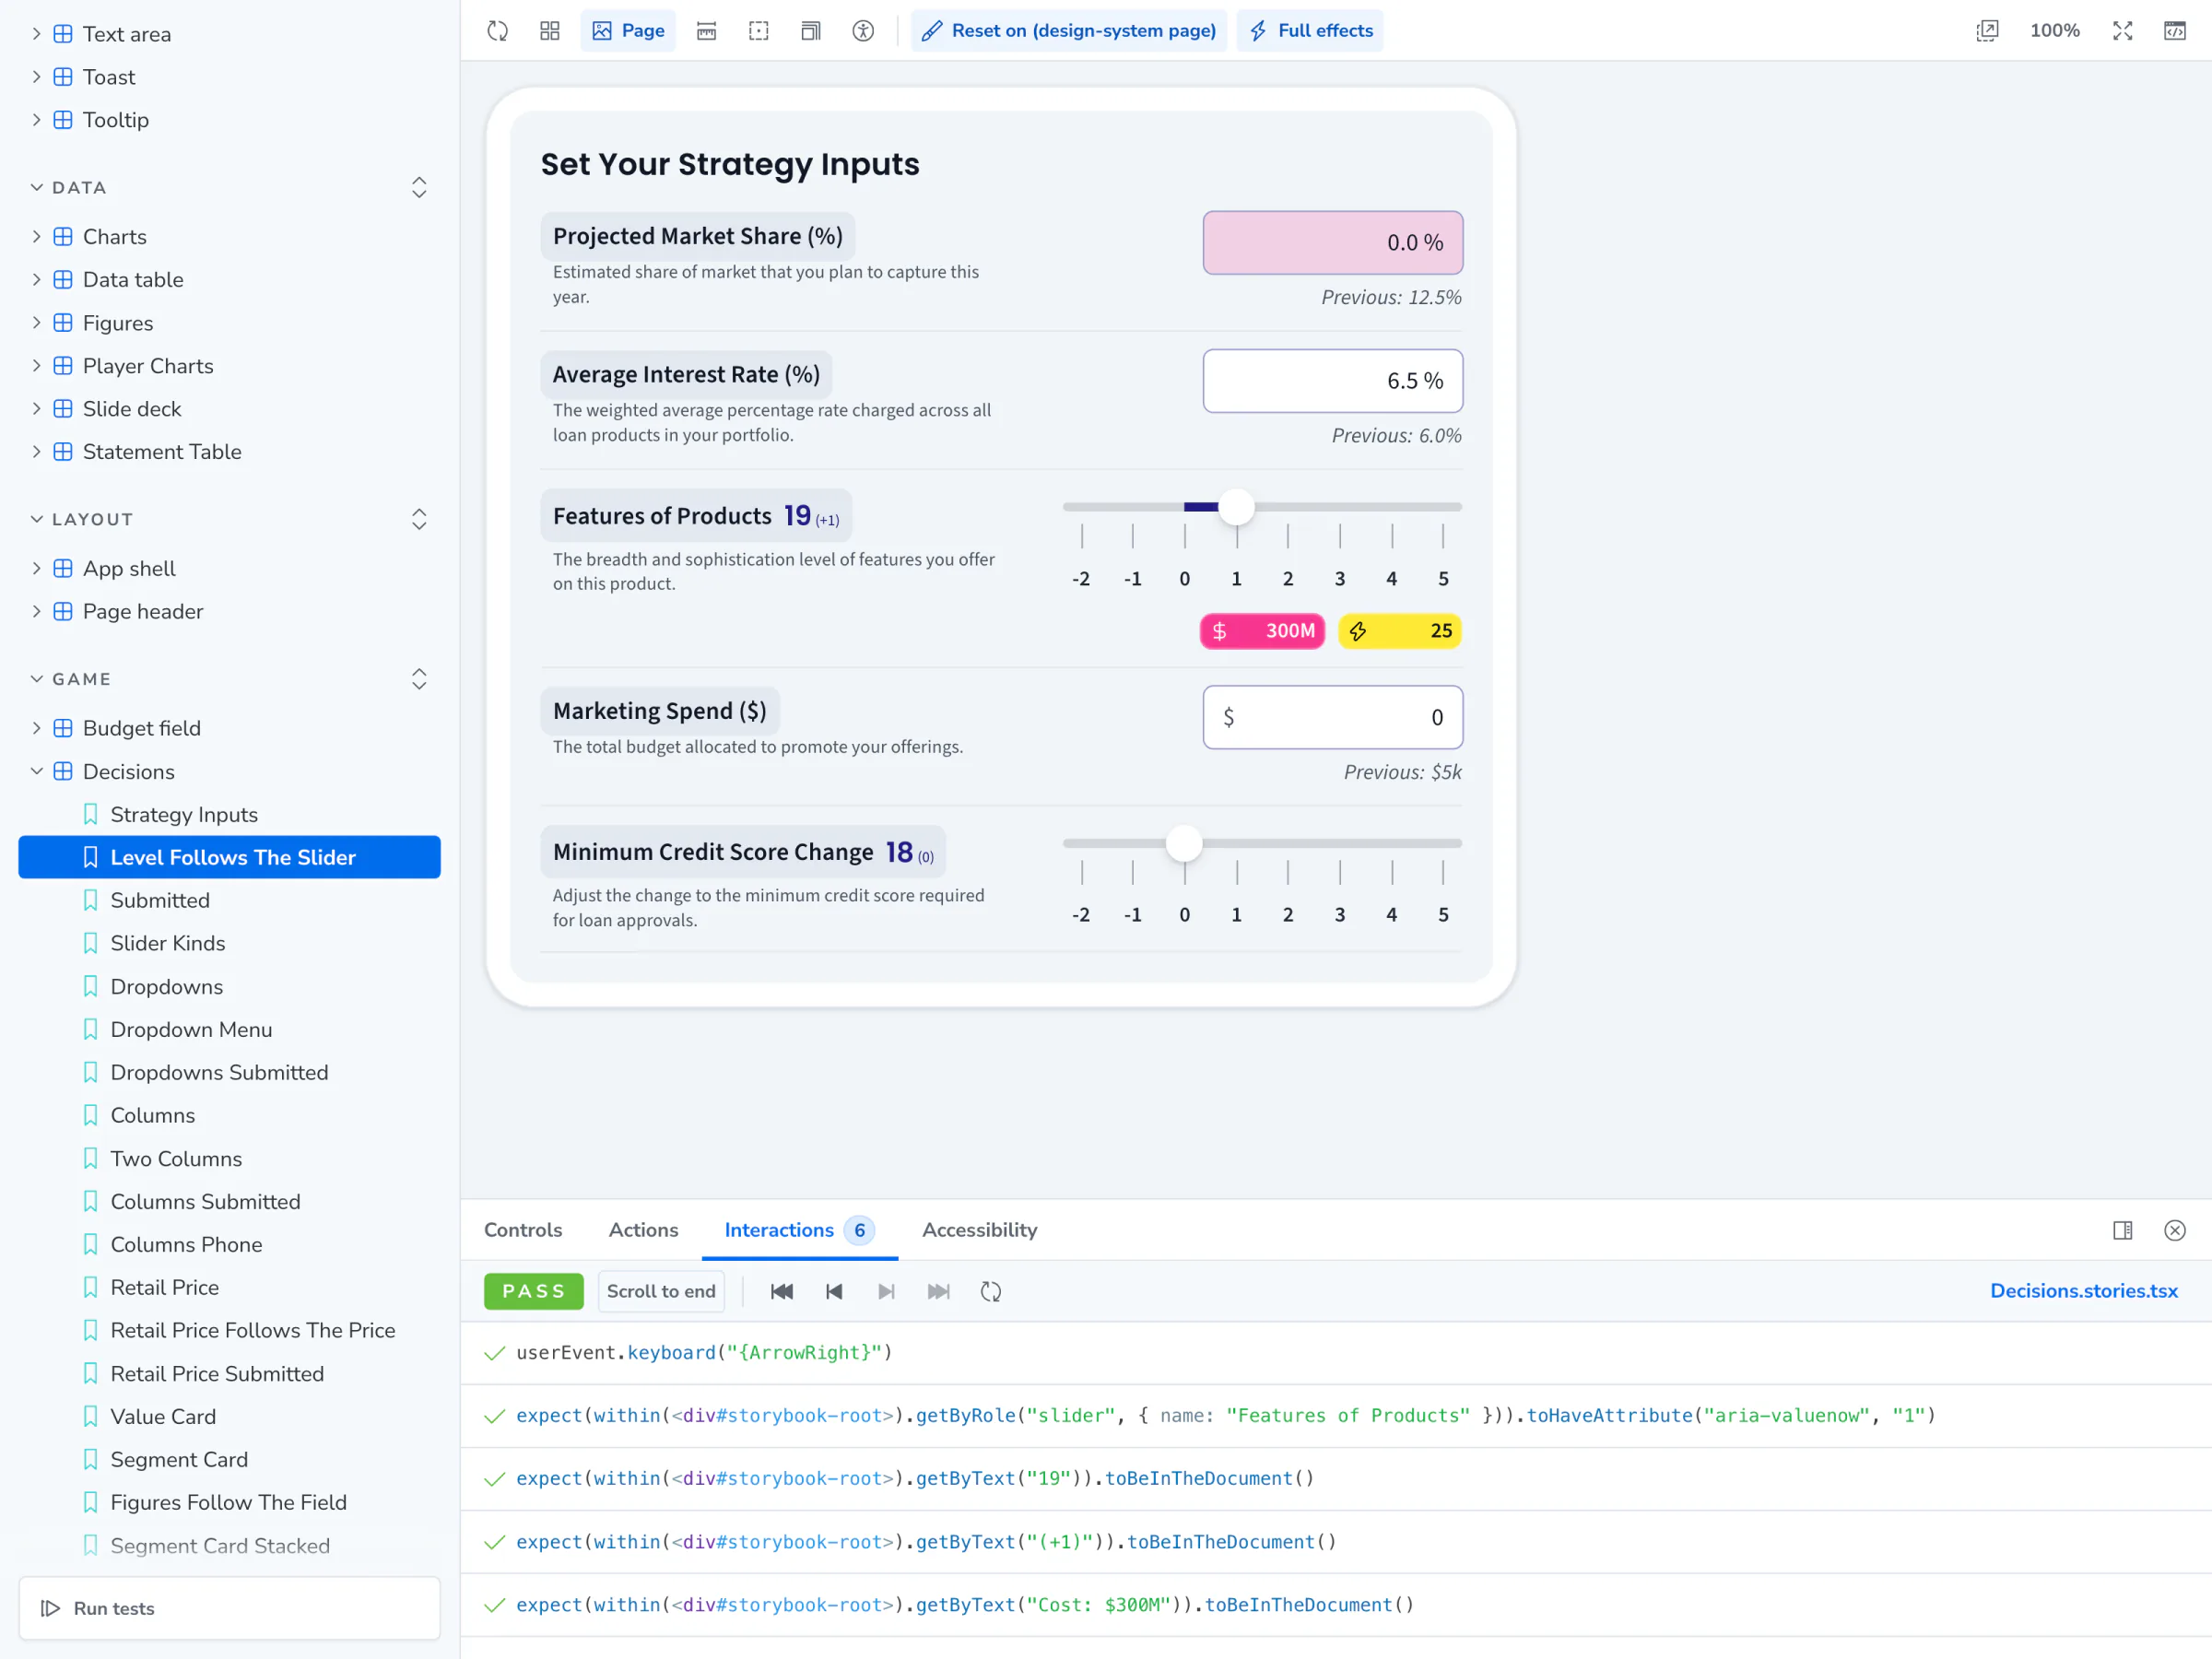
Three numbered pictures under "Set up. Play. Read the results.": a set-up form, a team's decision page, and result charts.
59Set up. Play. Read the results.
60 · VideoA round, played and computed
Recorded

What I Did

Set the brief and three standing rules. Made the five decisions put to me on 24 September 2026; the other 46 of 51 ran on a recommended default. Held Figma as the spec. Reviewed the Admin screen by screen. Supplied a Figma frame for the sign-in page. Played the product and reported what was broken. Approved the merges. Presented it on 29 September 2026.

Recorded

What the AI Sessions Did

Discovery with twelve research agents, the planning, and the building: the platform, the Admin, the design system, the server fixes and the local demo.

09

What Is Next

V2 is deployed and live in production. Next comes the rest of the players' move to the design system: ET Prime's group page and statements, then Mall and Product.


Case studies

Two Simulations Have Case-Study Pages of Their Own

All projects